Yesterday, we briefly introduced Quantopian and how to ingest Quandl WIKI Bundle data . Today, we are going to briefly summarize the financial data source and how to retrieve Google and Yahoo finance data using pandas_datareader .
1. Google Finance Data and Yahoo Finance Data State-of-the-art finance data source are partly summarized at Financial Hacker . Our recommended solution is to retrieve stock data by using a SINGLE framework: pandas_datareader . Yahoo Finance Data and Google Finance Data can be easily retrieved by This Learn Data Science Tutorial .
Source
Request Link
Stock Exchange Symbol (INDEX)
Stock Symbol (DATA)
Google Finance
https://www.google.ca/finance?q=INDEX:DATA INDEX, ex:
DATA, ex:
Yahoo Finance
https://finance.yahoo.com/quote/DATA?p=DATA Totally, Yahoo provides the following indexes:
DATA ex:
A comparatively old blog Python for Finance, Part I: Yahoo & Google Finance API, pandas, and matplotlib has already given a fabulous summary. However, with the development of Python, code for finance data loading needs to be modified a bit. For 4 different data resource:
1 2 3 4 5 6 7 tickers = ['AAPL' , 'MSFT' , '^GSPC' ] start_date = '2017-01-01' end_date = '2017-12-31' df = data.DataReader(tickers, data_source='google' , start=start_date, end=end_date)
Exception has occurred: pandas_datareader.exceptions.ImmediateDeprecationError
Google finance has been immediately deprecated due to large breaks in the API without the introduction of a stable replacement. Pull Requests to re-enable these data connectors are welcome. See https://github.com/pydata/pandas-datareader/issues
File "....../test.py", line 16, in
df = data.DataReader(tickers, data_source='google', start=start_date, end=end_date)
From pandas-datareader issues 487 , we can tell Google Finance API is currently down. Therefore, let’s ignore Google Finance for now.
On the other hand, from the following 3 finance data resource, the following printed tables and generated pictures demonstrate that stock data can be successfully loaded.
1 2 3 4 5 6 7 tickers = ['AAPL' , 'MSFT' , '^GSPC' ] start_date = '2017-01-01' end_date = '2017-12-31' df = data.DataReader(tickers, data_source='yahoo' , start=start_date, end=end_date)
1
2
3
4
5
6
7
8
9
10
11
12
13
14
15
16
17
18
19
20
21
22
23
24
25
26
27
28
29
30
31
32
33
34
35
36
37
38
39
40
41
42
43
44
45
46
47
48
49
50
51
Attributes High Low \ Symbols AAPL MSFT ^GSPC AAPL MSFT Date 2017-01-03 116.330002 62.840000 2263.879883 114.760002 62.130001 2017-01-04 116.510002 62.750000 2272.820068 115.750000 62.119999 2017-01-05 116.860001 62.660000 2271.500000 115.809998 62.029999 2017-01-06 118.160004 63.150002 2282.100098 116.470001 62.040001 2017-01-09 119.430000 63.080002 2275.489990 117.940002 62.540001 2017-01-10 119.379997 63.070000 2279.270020 118.300003 62.279999 2017-01-11 119.930000 63.230000 2275.320068 118.599998 62.430000 2017-01-12 119.300003 63.400002 2271.780029 118.209999 61.950001 2017-01-13 119.620003 62.869999 2278.679932 118.809998 62.349998 Attributes Open Close \ Symbols ^GSPC AAPL MSFT ^GSPC AAPL Date 2017-01-03 2245.129883 115.800003 62.790001 2251.570068 116.150002 2017-01-04 2261.600098 115.849998 62.480000 2261.600098 116.019997 2017-01-05 2260.449951 115.919998 62.189999 2268.179932 116.610001 2017-01-06 2264.060059 116.779999 62.299999 2271.139893 117.910004 2017-01-09 2268.899902 117.949997 62.759998 2273.590088 118.989998 2017-01-10 2265.270020 118.769997 62.730000 2269.719971 119.110001 2017-01-11 2260.830078 118.739998 62.610001 2268.600098 119.750000 2017-01-12 2254.250000 118.900002 63.060001 2271.139893 119.250000 2017-01-13 2271.510010 119.110001 62.619999 2272.739990 119.040001 Attributes Volume \ Symbols MSFT ^GSPC AAPL MSFT ^GSPC Date 2017-01-03 62.580002 2257.830078 28781900.0 20694100.0 3.770530e+09 2017-01-04 62.299999 2270.750000 21118100.0 21340000.0 3.764890e+09 2017-01-05 62.299999 2269.000000 22193600.0 24876000.0 3.761820e+09 2017-01-06 62.840000 2276.979980 31751900.0 19922900.0 3.339890e+09 2017-01-09 62.639999 2268.899902 33561900.0 20256600.0 3.217610e+09 2017-01-10 62.619999 2268.899902 24462100.0 18593000.0 3.638790e+09 2017-01-11 63.189999 2275.320068 27588600.0 21517300.0 3.620410e+09 2017-01-12 62.610001 2270.439941 27086200.0 20968200.0 3.462130e+09 2017-01-13 62.700001 2274.639893 26111900.0 19422300.0 3.081270e+09 Attributes Adj Close Symbols AAPL MSFT ^GSPC Date 2017-01-03 112.620964 60.431488 2257.830078 2017-01-04 112.494911 60.161095 2270.750000 2017-01-05 113.066986 60.161095 2269.000000 2017-01-06 114.327484 60.682560 2276.979980 2017-01-09 115.374664 60.489429 2268.899902 2017-01-10 115.491020 60.470112 2268.899902 2017-01-11 116.111588 61.020542 2275.320068 2017-01-12 115.626762 60.460461 2270.439941 2017-01-13 115.423149 60.547371 2274.639893
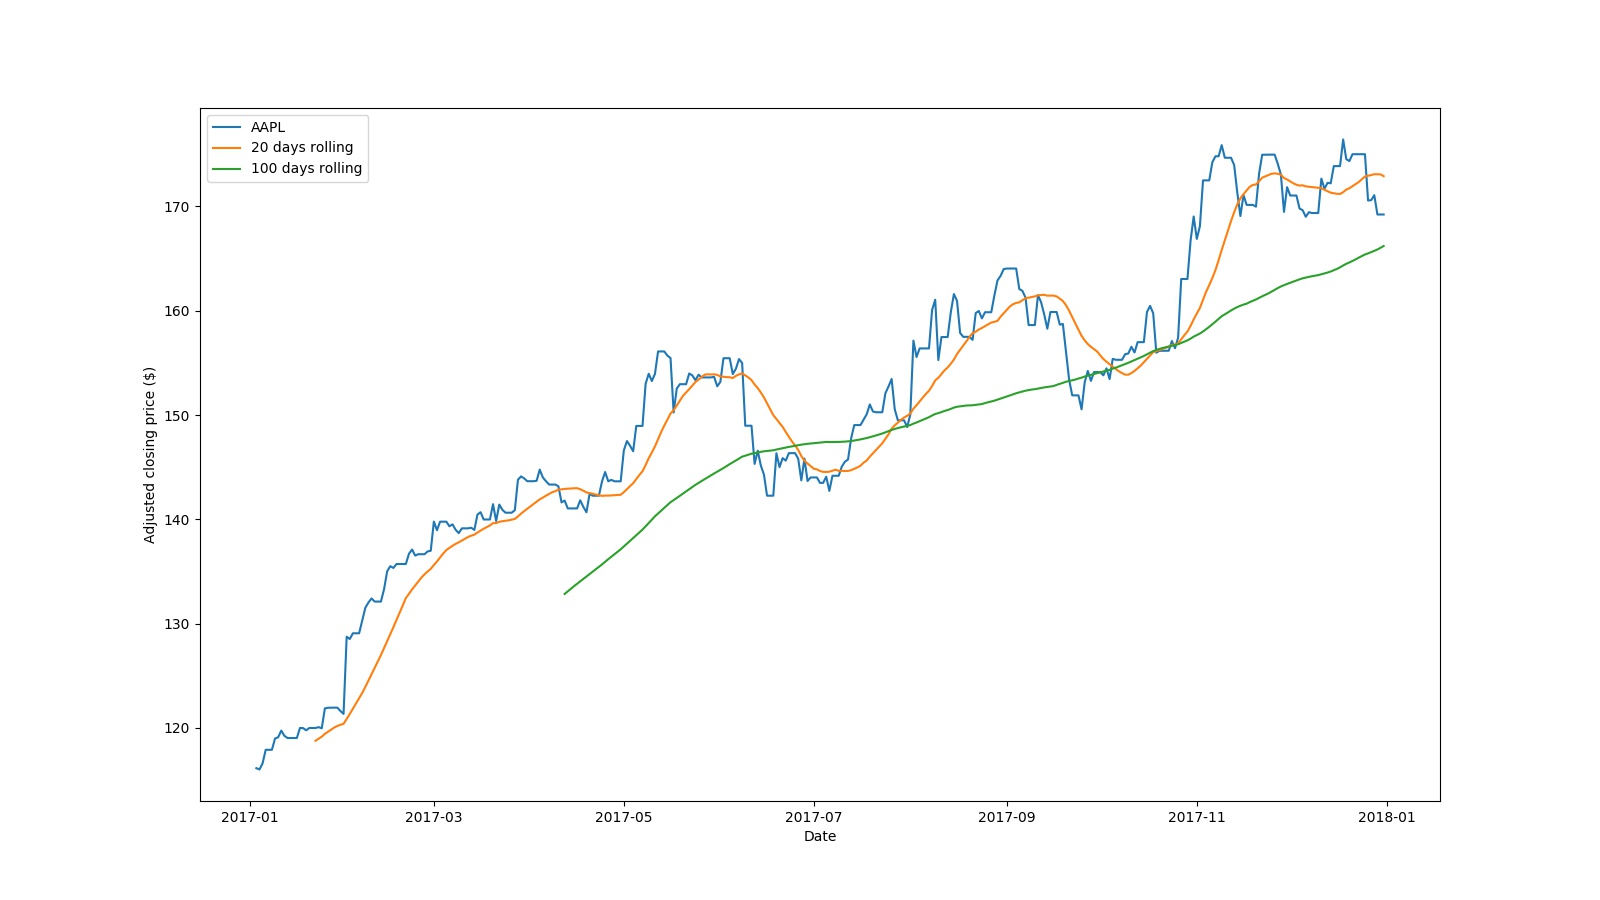
AAPL Closing Price
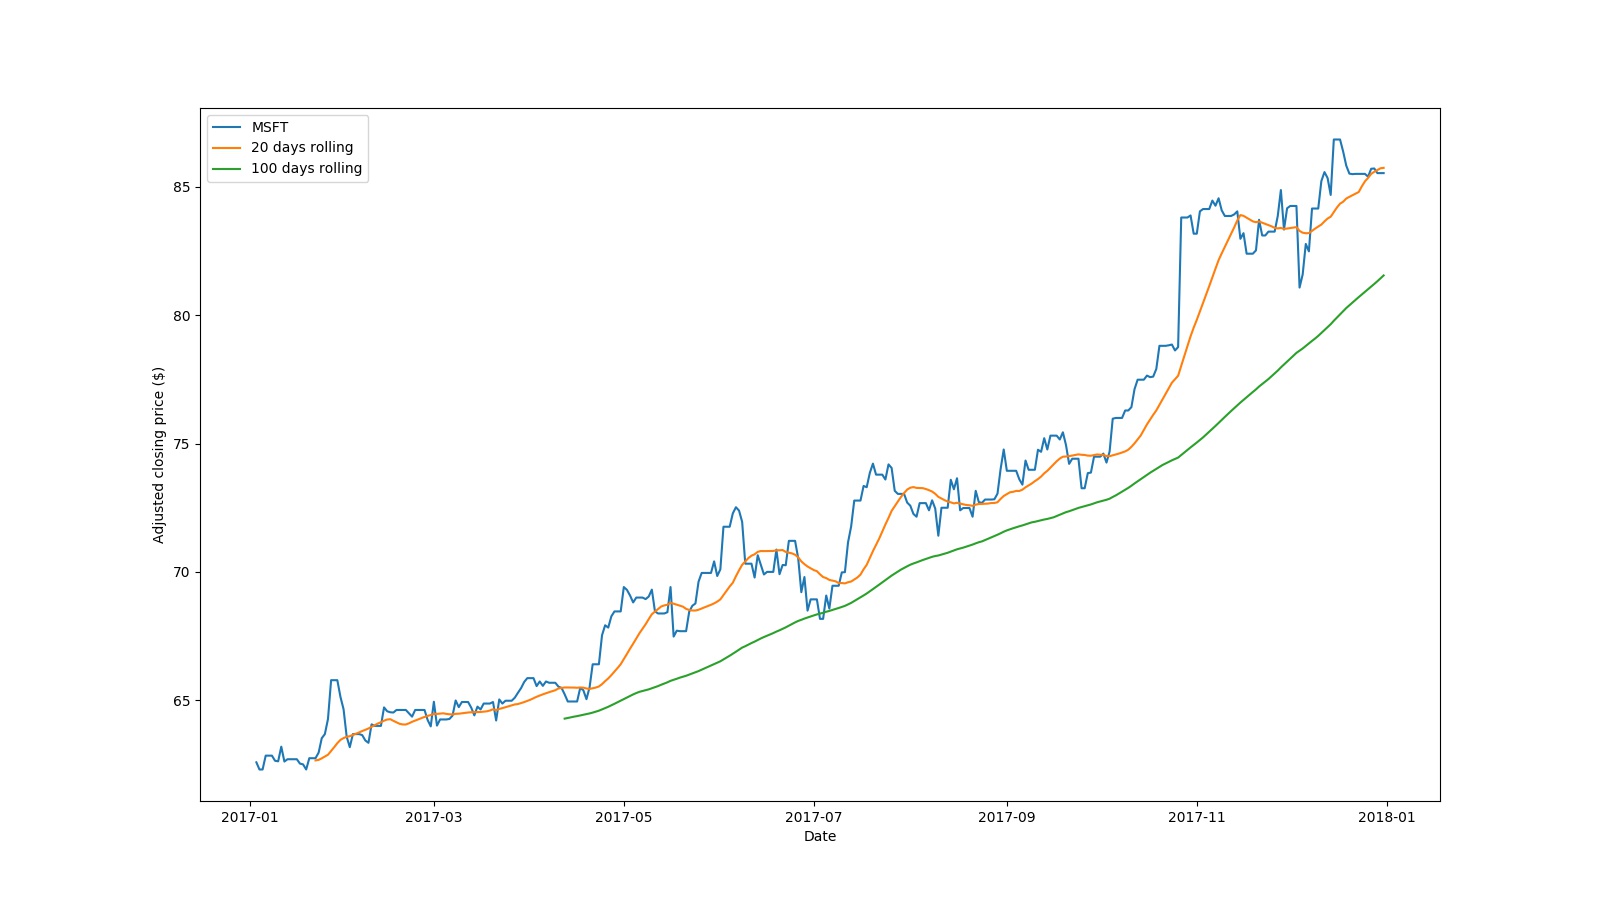
MSFT Closing Price
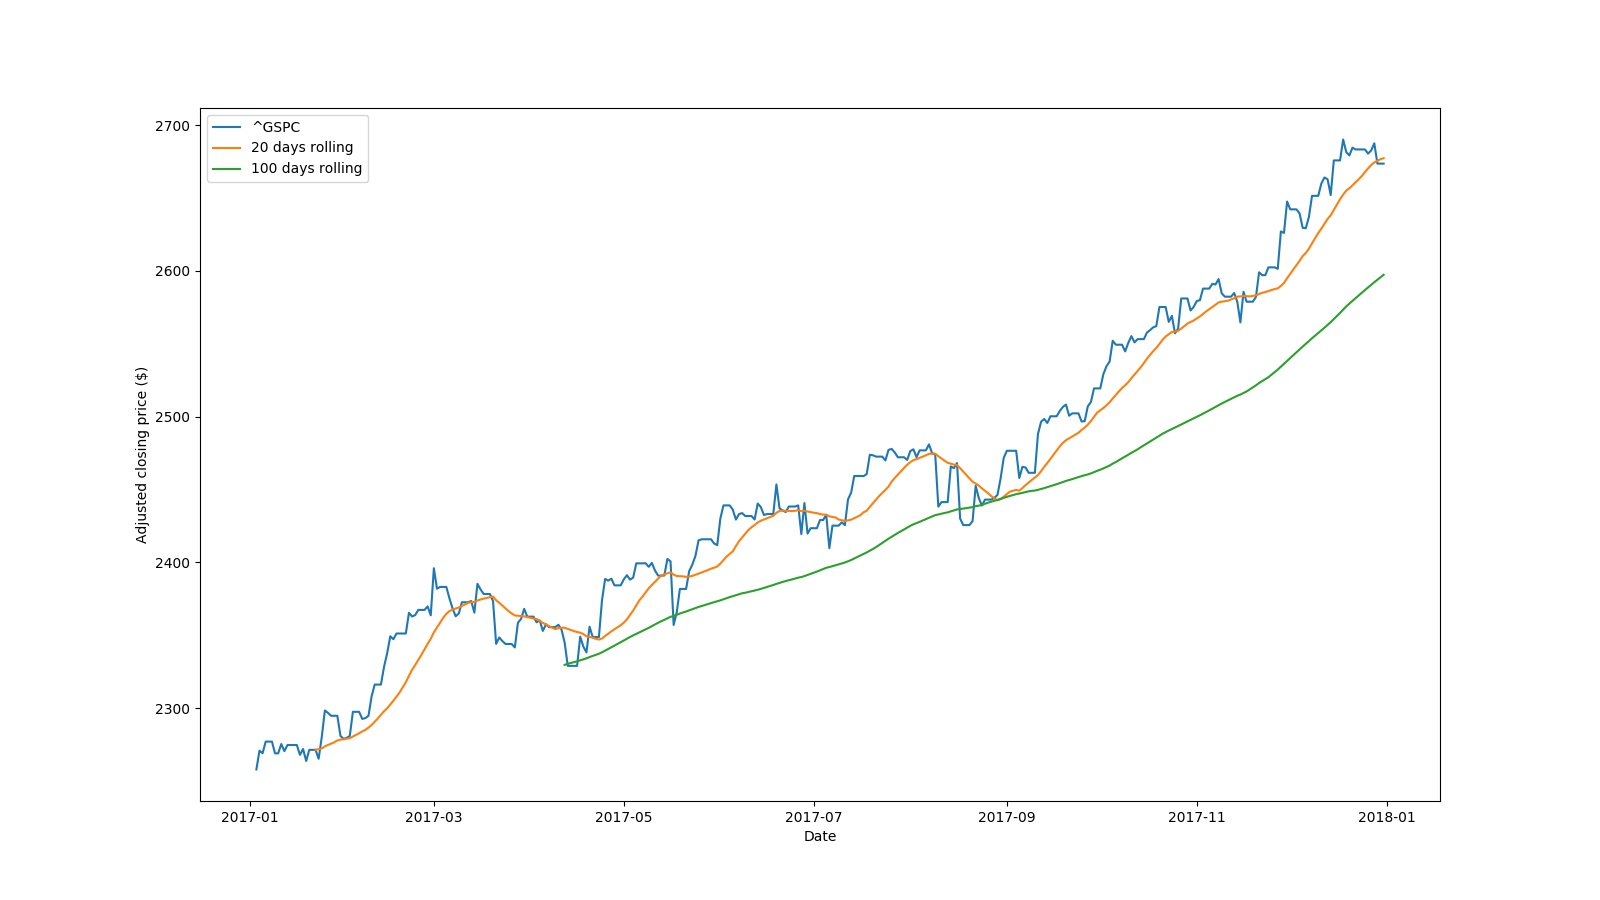
S&P 500 Closing Price
1 2 3 4 5 6 7 tickers = ['AAPL' , 'MSFT' , 'SPY' ] start_date = '2017-01-01' end_date = '2017-12-31' df = data.DataReader(tickers, data_source="iex" , start=start_date, end=end_date)
1
2
3
4
5
6
7
8
9
10
11
12
13
14
15
16
17
18
19
20
21
22
23
24
25
26
27
28
29
30
31
32
33
34
35
36
37
38
Attributes open high \ Symbols AAPL MSFT SPY AAPL MSFT SPY date 2017-01-03 112.6732 60.6343 217.9106 113.1889 60.6825 218.6756 2017-01-04 112.7219 60.3349 218.4722 113.3641 60.5956 219.5664 2017-01-05 112.7900 60.0549 219.1016 113.7087 60.5087 219.4018 2017-01-06 113.6268 60.1611 219.3534 114.9695 60.9819 220.5347 2017-01-09 114.7652 60.6053 219.7213 116.2052 60.9143 219.8764 2017-01-10 115.5630 60.5763 219.3050 116.1566 60.9046 220.2442 2017-01-11 115.5338 60.4604 219.1888 116.6917 61.0591 219.9053 2017-01-12 115.6847 60.8950 219.3243 116.0787 61.2233 219.5664 2017-01-13 115.8939 60.4701 219.5470 116.3901 60.7067 220.1958 Attributes low close \ Symbols AAPL MSFT SPY AAPL MSFT SPY date 2017-01-03 111.6613 59.9921 216.7909 113.0138 60.4315 218.1043 2017-01-04 112.6246 59.9873 218.4625 112.8873 60.1611 219.4018 2017-01-05 112.6830 59.9003 218.3366 113.4614 60.1611 219.2275 2017-01-06 113.3251 59.9100 218.7433 114.7263 60.6825 220.0118 2017-01-09 114.7554 60.3928 219.2433 115.7771 60.4894 219.2856 2017-01-10 115.1057 60.1418 218.8499 115.8939 60.4701 219.2856 2017-01-11 115.3976 60.2866 218.4432 116.5166 61.0205 219.9053 2017-01-12 115.0182 59.8231 217.8283 116.0301 60.4604 219.3534 2017-01-13 115.6020 60.2094 219.5083 115.8257 60.5473 219.8569 Attributes volume Symbols AAPL MSFT SPY date 2017-01-03 28781865 20694101 91366522 2017-01-04 21118116 21339969 78744433 2017-01-05 22193587 24875968 78379012 2017-01-06 31751900 19922919 71559922 2017-01-09 33561948 20382730 46939676 2017-01-10 24462051 18593004 63771939 2017-01-11 27588593 21517335 74650016 2017-01-12 27086220 20968223 72113181 2017-01-13 26111948 19422310 62717865
As shown, for IEX , the retrieved data is in reversed order, and there is a hidden ERROR about the time so far. Let’s just ignore it at this stage.
Note Quandl ,
you may have to load ONE data at a time
you may have to subscribe and pay to obtain S&P 500 data? Anyway, please refer to Quandl MULTPL and multpl.com
1 2 3 4 5 start_date = '2017-01-01' end_date = '2017-12-31' df = data.DataReader('AAPL' , data_source="quandl" , start=start_date, end=end_date, access_key="your-quandl-api-key" )
AAPL 1 2 3 4 5 6 7 8 9 10 11 12 13 14 15 16 17 18 19 20 21 22 23 Open High Low Close Volume ExDividend \ Date 2017-12-29 170.52 170.590 169.220 169.23 25643711.0 0.0 2017-12-28 171.00 171.850 170.480 171.08 15997739.0 0.0 2017-12-27 170.10 170.780 169.710 170.60 21672062.0 0.0 2017-12-26 170.80 171.470 169.679 170.57 32968167.0 0.0 2017-12-22 174.68 175.424 174.500 175.01 16052615.0 0.0 2017-12-21 174.17 176.020 174.100 175.01 20356826.0 0.0 2017-12-20 174.87 175.420 173.250 174.35 23000392.0 0.0 2017-12-19 175.03 175.390 174.090 174.54 27078872.0 0.0 2017-12-18 174.88 177.200 174.860 176.42 28831533.0 0.0 SplitRatio AdjOpen AdjHigh AdjLow AdjClose AdjVolume Date 2017-12-29 1.0 170.52 170.590 169.220 169.23 25643711.0 2017-12-28 1.0 171.00 171.850 170.480 171.08 15997739.0 2017-12-27 1.0 170.10 170.780 169.710 170.60 21672062.0 2017-12-26 1.0 170.80 171.470 169.679 170.57 32968167.0 2017-12-22 1.0 174.68 175.424 174.500 175.01 16052615.0 2017-12-21 1.0 174.17 176.020 174.100 175.01 20356826.0 2017-12-20 1.0 174.87 175.420 173.250 174.35 23000392.0 2017-12-19 1.0 175.03 175.390 174.090 174.54 27078872.0 2017-12-18 1.0 174.88 177.200 174.860 176.42 28831533.0
MSFT 1 2 3 4 5 6 7 8 9 10 11 12 13 14 15 16 17 18 19 20 21 22 23 Open High Low Close Volume ExDividend SplitRatio \ Date 2017-12-29 85.63 86.0500 85.500 85.54 18162779.0 0.0 1.0 2017-12-28 85.90 85.9300 85.550 85.72 9872795.0 0.0 1.0 2017-12-27 85.65 85.9800 85.215 85.71 13000828.0 0.0 1.0 2017-12-26 85.31 85.5346 85.030 85.40 9737412.0 0.0 1.0 2017-12-22 85.40 85.6300 84.920 85.51 14033977.0 0.0 1.0 2017-12-21 86.05 86.1000 85.400 85.50 16638402.0 0.0 1.0 2017-12-20 86.20 86.3000 84.710 85.52 23425009.0 0.0 1.0 2017-12-19 86.35 86.3500 85.270 85.83 23241979.0 0.0 1.0 2017-12-18 87.12 87.4999 86.230 86.38 21551076.0 0.0 1.0 AdjOpen AdjHigh AdjLow AdjClose AdjVolume Date 2017-12-29 85.63 86.0500 85.500 85.54 18162779.0 2017-12-28 85.90 85.9300 85.550 85.72 9872795.0 2017-12-27 85.65 85.9800 85.215 85.71 13000828.0 2017-12-26 85.31 85.5346 85.030 85.40 9737412.0 2017-12-22 85.40 85.6300 84.920 85.51 14033977.0 2017-12-21 86.05 86.1000 85.400 85.50 16638402.0 2017-12-20 86.20 86.3000 84.710 85.52 23425009.0 2017-12-19 86.35 86.3500 85.270 85.83 23241979.0 2017-12-18 87.12 87.4999 86.230 86.38 21551076.0
| AAPL Closing Price | MSFT Closing Price |
fix-yahoo-finance .
googlefinance.client

 |
|  |
|