0%

Time Series Forecasting with Facebook Prophet

Today, we are going to test out Facebook Prophet by following this DigitalOcean Tutorial.

Preparation

Required Python Packages

We FIRST make sure 2 Python packages - Prophet and PyStan have been successfully installed.

1
2
3
4
5
6
7
8
9
10
11
12
13
14
15
16
17
18
19
20
21
22
➜  ~ pip show prophet
Name: prophet
Version: 0.1.1
Summary: Microframework for analyzing financial markets.
Home-page: http://prophet.michaelsu.io/
Author: Michael Su
Author-email: mdasu1@gmail.com
License: BSD
Location: /home/jiapei/.local/lib/python3.6/site-packages
Requires: six, pytz, pandas
Required-by:
➜ ~ pip show pystan
Name: pystan
Version: 2.18.1.0
Summary: Python interface to Stan, a package for Bayesian inference
Home-page: https://github.com/stan-dev/pystan
Author: None
Author-email: None
License: GPLv3
Location: /home/jiapei/.local/lib/python3.6/site-packages
Requires: Cython, numpy
Required-by: fbprophet

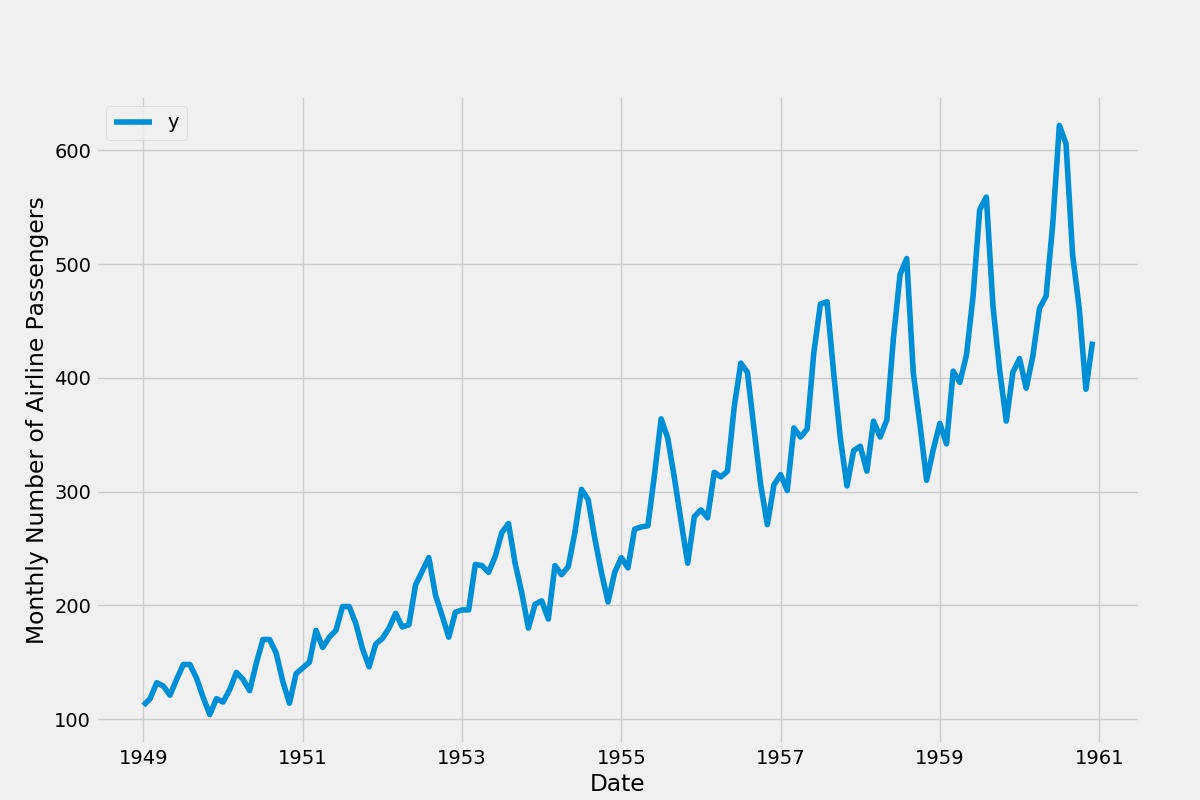
Download the Time Series Data

We just need to download the CSV file to some directory:

1
2
3
4
➜  facebookprophet curl -O https://assets.digitalocean.com/articles/eng_python/prophet/AirPassengers.csv
% Total % Received % Xferd Average Speed Time Time Time Current
Dload Upload Total Spent Left Speed
100 1748 100 1748 0 0 2281 0 --:--:-- --:--:-- --:--:-- 2279

Test

The Code

Trivial modifications have been done upon the code on this DigitalOcean Tutorial, as follows:

1
2
3
4
5
6
7
8
9
10
11
12
13
14
15
16
17
18
19
20
21
22
23
24
25
26
27
28
29
30
31
32
33
import pandas as pd
from fbprophet import Prophet

import matplotlib.pyplot as plt
plt.style.use('fivethirtyeight')

df = pd.read_csv('AirPassengers.csv')
df.head(5)
df.dtypes

df['Month'] = pd.DatetimeIndex(df['Month'])
df.dtypes

df = df.rename(columns={'Month': 'ds', 'AirPassengers': 'y'})
df.head(5)

ax = df.set_index('ds').plot(figsize=(12, 8))
ax.set_ylabel('Monthly Number of Airline Passengers')
ax.set_xlabel('Date')

plt.show()

# set the uncertainty interval to 95% (the Prophet default is 80%)
my_model = Prophet(interval_width=0.95)
my_model.fit(df)
future_dates = my_model.make_future_dataframe(periods=36, freq='MS')
future_dates.tail()
forecast = my_model.predict(future_dates)
forecast[['ds', 'yhat', 'yhat_lower', 'yhat_upper']].tail()
fig1 = my_model.plot(forecast, uncertainty=True)
fig1.show()

my_model.plot_components(forecast).savefig('prophet_forcast.png');

Outcome

Original Data
Forcast
Forcast Component