Finally, I’m talking about Geographic Information System , namely, GIS . Remote Sensing and Information Engineer is my bachelor’s major in Wuhan Technical University of Surveying and Mapping , which is NOW a part of Wuhan University . When I was in the university, I NEVER thought I was in such an amazing department, studying such an amazing major.
Alright… Let’s start today’s blog. We’re going to play OpenStreetMap for some fun.
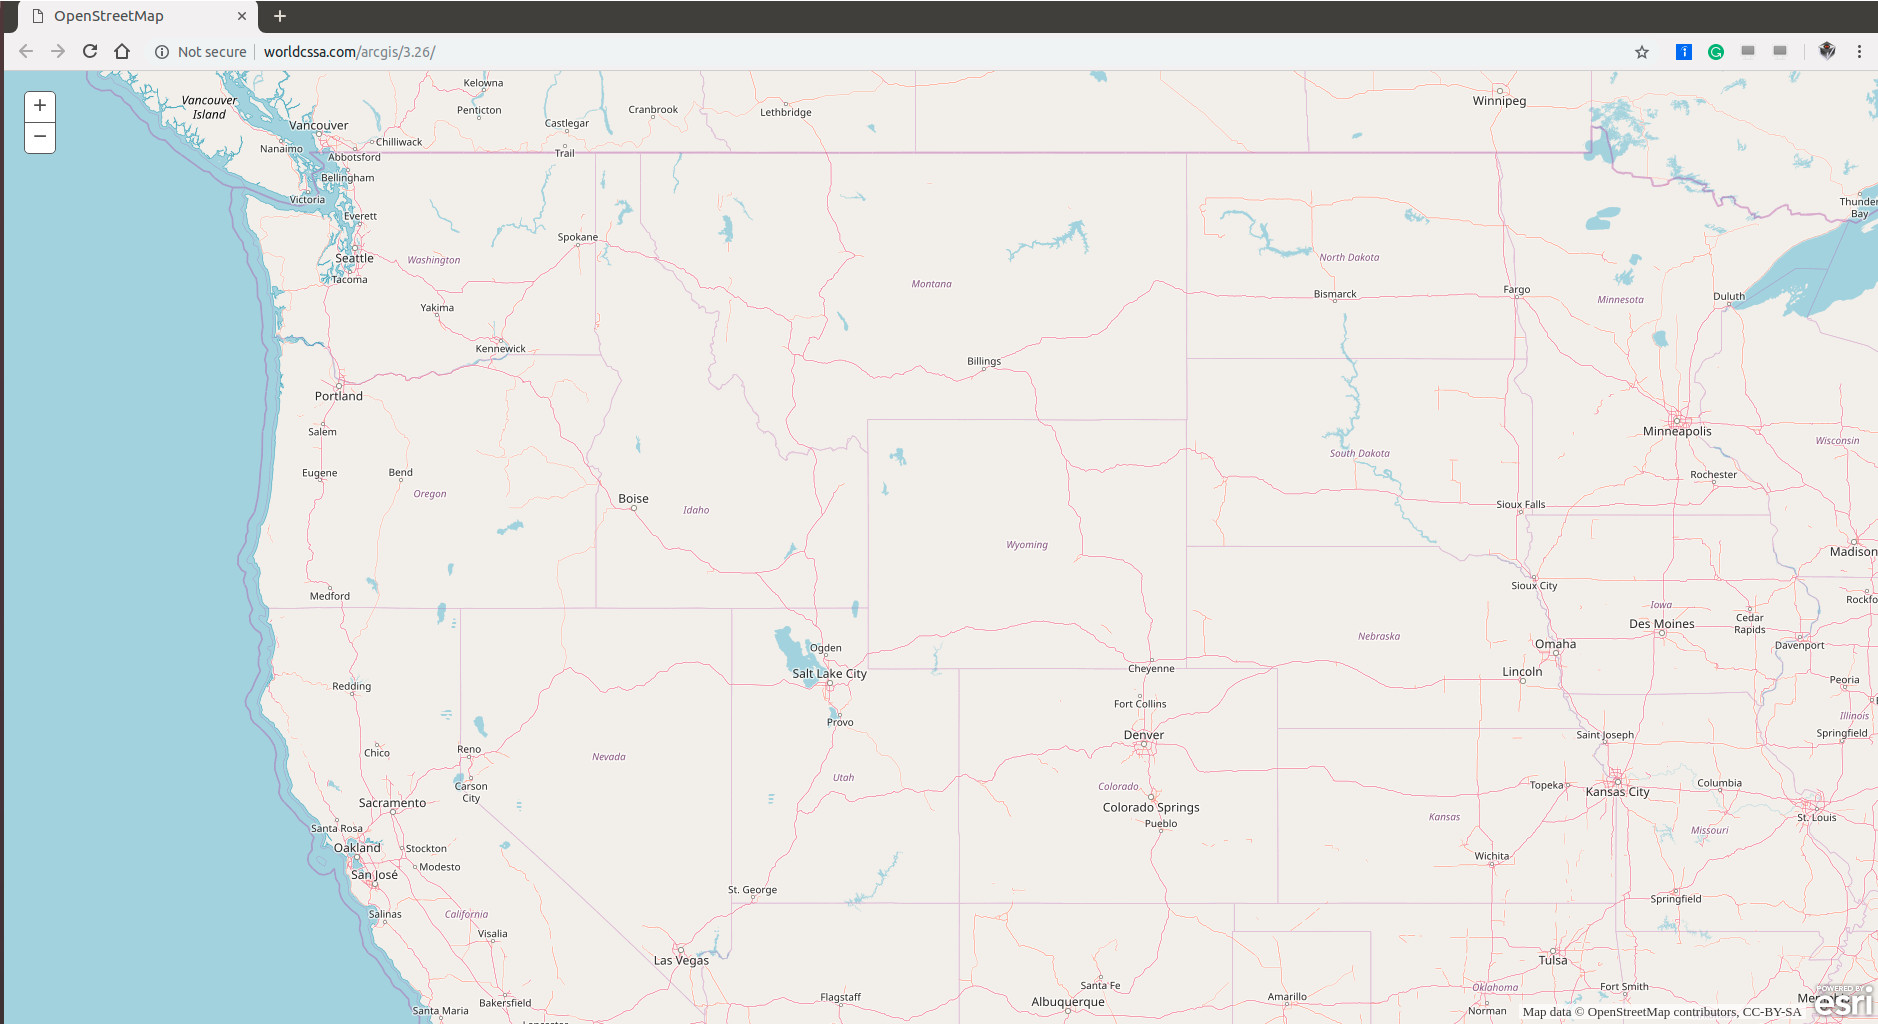
We FIRST test out how ArcGIS displays OpenStreetMap .
A snippet of sample code is provided for ArcGIS Version 3.26 , cited as follows:
1 2 3 4 5 6 7 8 9 10 11 12 13 14 15 16 17 18 19 20 21 22 23 24 25 26 27 28 29 30 31 32 33 34 35 36 37 38 <!DOCTYPE html> <html > <head > <meta http-equiv ="Content-Type" content ="text/html; charset=utf-8" /> <meta name ="viewport" content ="initial-scale=1, maximum-scale=1,user-scalable=no" /> <title > OpenStreetMap</title > <link rel ="stylesheet" href ="https://js.arcgis.com/3.26/esri/css/esri.css" > <style > html , body , #esri-map-container { padding : 0px ; margin : 0px ; height : 100% ; } </style > <script src ="https://js.arcgis.com/3.26/" > </script > <script > require ([ "esri/map" , "esri/layers/OpenStreetMapLayer" , "dojo/domReady!" ], function (Map , OpenStreetMapLayer var map, openStreetMapLayer; map = new Map ("esri-map-container" , { center : [-89.924 , 30.036 ], zoom : 12 }); openStreetMapLayer = new OpenStreetMapLayer (); map.addLayer (openStreetMapLayer); }); </script > </head > <body > <div id ="esri-map-container" > </div > </body > </html >
Please click on the following image and have a try.
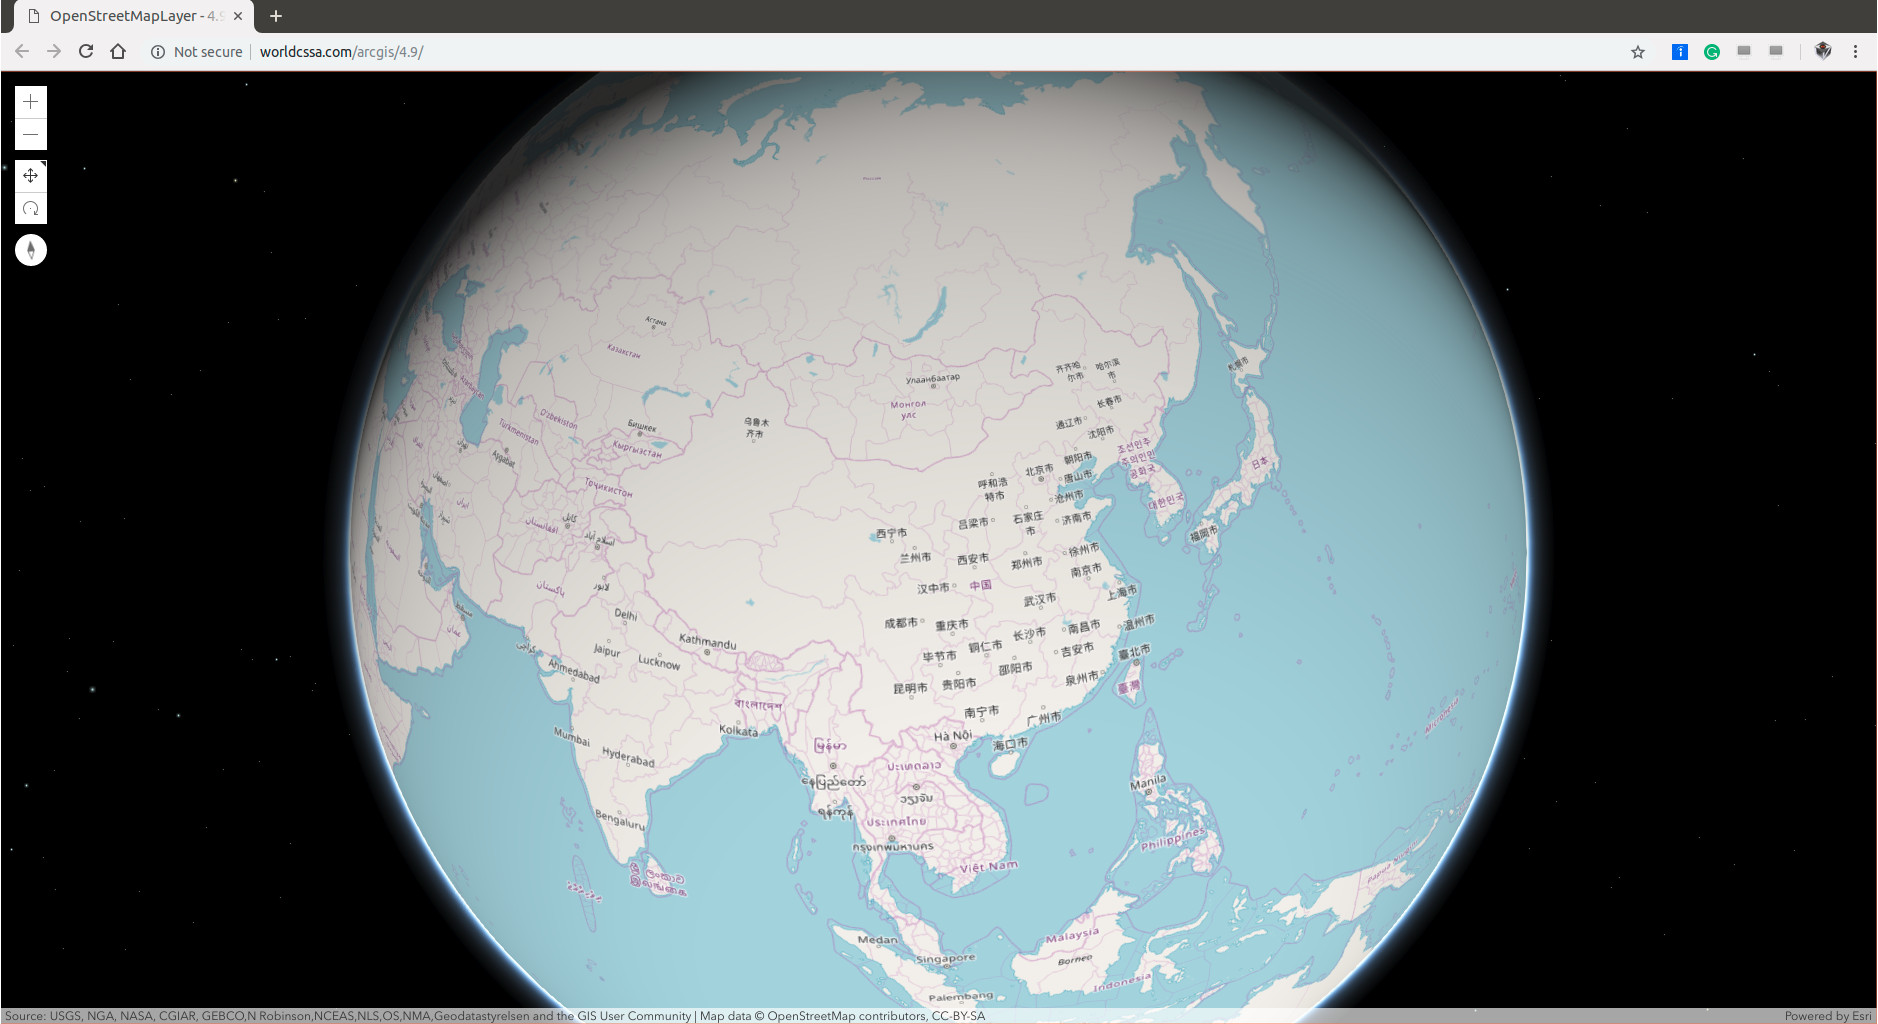
A snippet of sample code is provided for ArcGIS LATEST Version 4.9 , cited as follows:
1 2 3 4 5 6 7 8 9 10 11 12 13 14 15 16 17 18 19 20 21 22 23 24 25 26 27 28 29 30 31 32 33 34 35 36 37 38 39 40 41 42 43 44 45 46 47 48 49 50 51 52 53 <!DOCTYPE html> <html> <head> <meta charset="utf-8"> <meta name="viewport" content="initial-scale=1,maximum-scale=1,user-scalable=no"> <title>OpenStreetMapLayer - 4.9</title> <style> html, body, #viewDiv { padding: 0; margin: 0; height: 100%; width: 100%; } </style> <link rel="stylesheet" href="https://js.arcgis.com/4.9/esri/css/main.css"> <script src="https://js.arcgis.com/4.9/"></script> <script> require([ "esri/layers/OpenStreetMapLayer", "esri/Map", "esri/views/SceneView" ], function( OpenStreetMapLayer, Map, SceneView ) { var map = new Map({ ground: "world-elevation" }); var view = new SceneView({ map: map, container: "viewDiv" }); var osmLayer = new OpenStreetMapLayer(); map.add(osmLayer); }); </script> </head> <body> <div id="viewDiv"></div> </body> </html>
Please click on the following image and have a try.
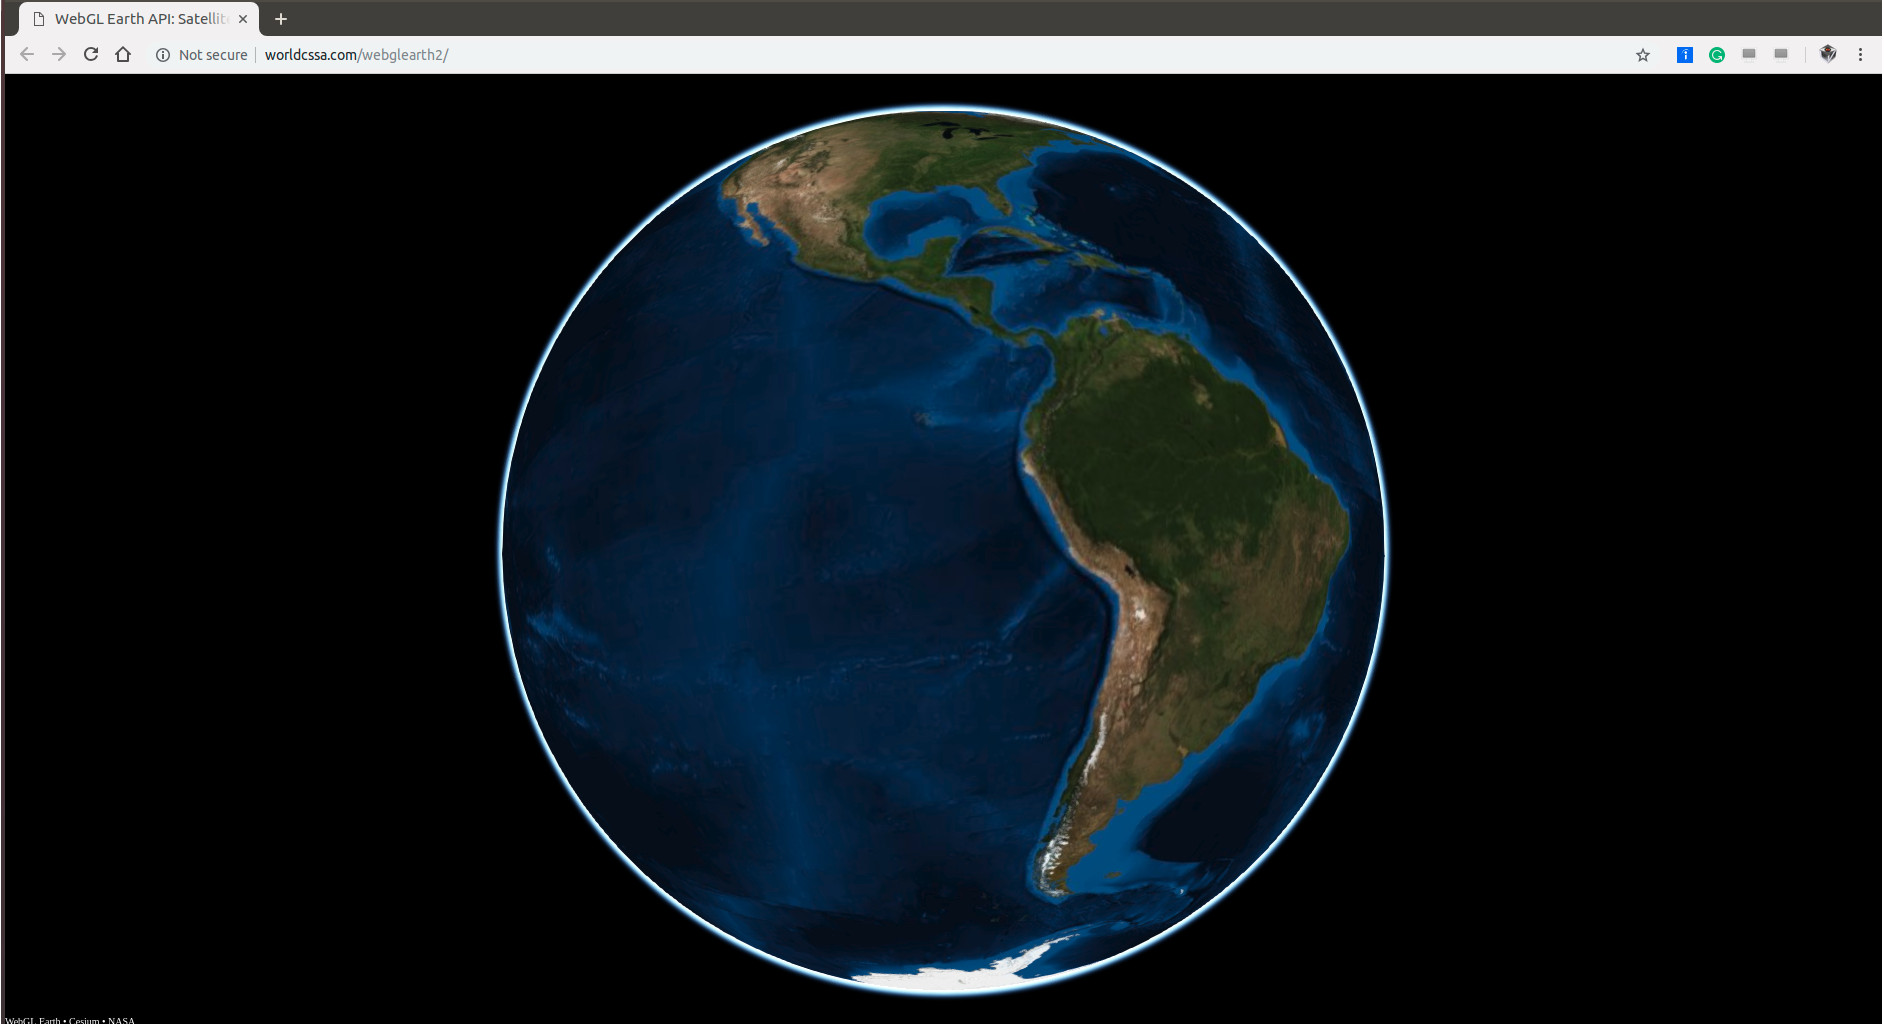
ArcGIS is like the CROWN of GIS . Its SDK/API seems NOT fully open source but commercial. Therefore, I’d love to breifly test out some other open source.
Several WebGLEarth examples are given at http://examples.webglearth.com/ , and we just try out the very FIRST example Satellite . The code is cited as:
1 2 3 4 5 6 7 8 9 10 11 12 13 14 15 16 17 18 19 20 21 22 23 24 25 26 <!DOCTYPE HTML > <html > <head > <script src ="http://www.webglearth.com/v2/api.js" > </script > <script > function initialize ( var options = {atmosphere : true , center : [0 , 0 ], zoom : 0 }; var earth = new WE .map ('earth_div' , options); WE .tileLayer ('http://tileserver.maptiler.com/nasa/{z}/{x}/{y}.jpg' , { minZoom : 0 , maxZoom : 5 , attribution : 'NASA' }).addTo (earth); } </script > <style > html , body {padding : 0 ; margin : 0 ;} #earth_div {top : 0 ; right : 0 ; bottom : 0 ; left : 0 ; background-color : #000 ; position : absolute !important ;} </style > <title > WebGL Earth API: Satellite</title > </head > <body onload ="initialize()" > <div id ="earth_div" > </div > </body > </html >
Please click on the following image and have a try.
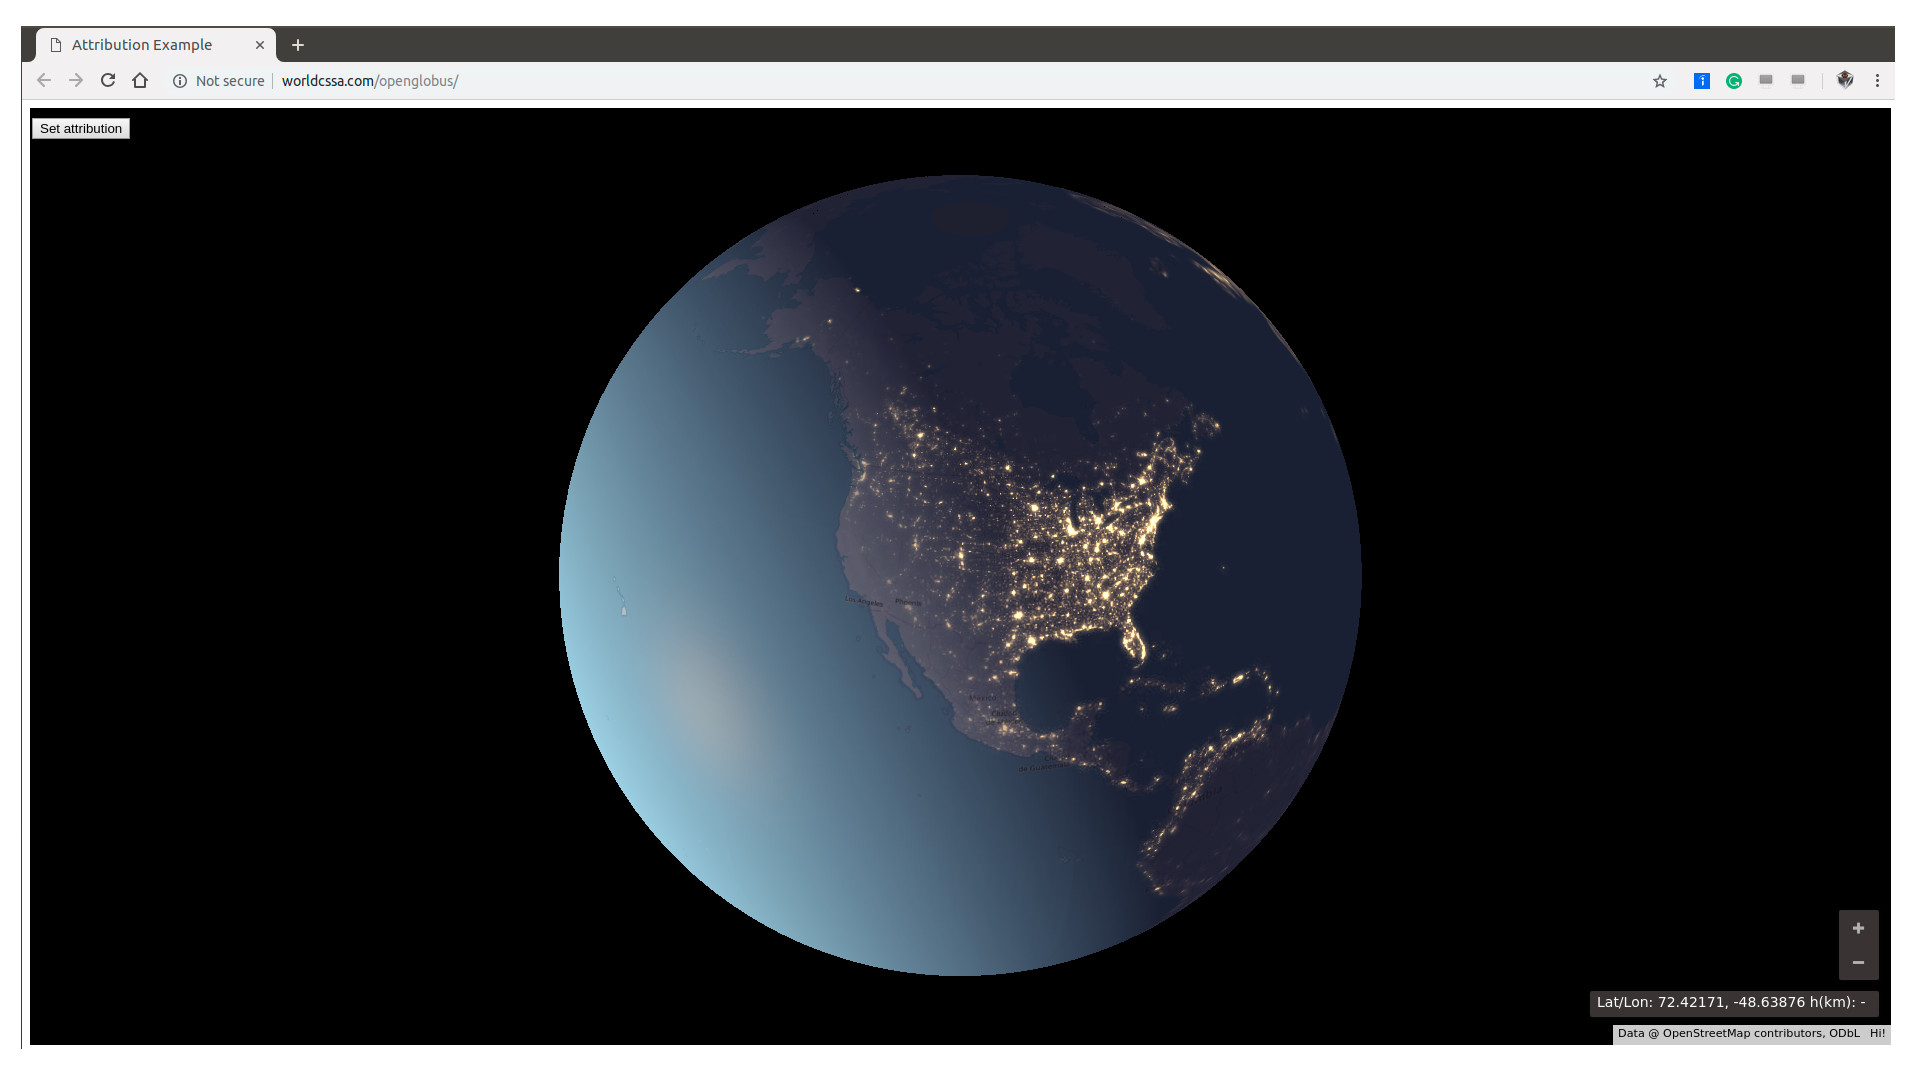
“OpenGlobus is a javascript library designed to display interactive 3d maps and planets with map tiles, imagery and vector data, markers and 3d objects. It uses the WebGL technology, open source and completely free.” (Cited from OpenGlobus Github ). Let’s just take the very FIRST example Og - examples: Attribution as our example. Code is cited as follows:
1
2
3
4
5
6
7
8
9
10
11
12
13
14
15
16
17
18
19
20
21
22
23
24
25
26
27
28
29
30
31
32
33
34
35
36
37
38
39
40
41
42
43
44
45
46
47
48
49
50
51
<html> <head > <title > Attribution Example</title > <meta name ="viewport" content ="width=device-width, initial-scale=1.0" > <link rel ="stylesheet" href ="http://www.openglobus.org/og.css" type ="text/css" /> <script src ="http://www.openglobus.org/og.js" > </script > </head > <body > <div id ="globus" style ="width:100%;height:100%" > </div > <button id ="btnOSM" style ="position: absolute; left:0; margin:10px;" > Set attribution</button > <script > document .getElementById ("btnOSM" ).onclick = function ( states.setAttribution ("Hello, WMS default USA population states example!" ); }; let osm = new og.layer .XYZ ("OpenStreetMap" , { specular : [0.0003 , 0.00012 , 0.00001 ], shininess : 20 , diffuse : [0.89 , 0.9 , 0.83 ], isBaseLayer : true , url : "http://{s}.tile.openstreetmap.org/{z}/{x}/{y}.png" , visibility : true , attribution : 'Data @ OpenStreetMap contributors, ODbL' }); let states = new og.layer .WMS ("USA Population" , { extent : [[-128 , 24 ], [-66 , 49 ]], visibility : true , isBaseLayer : false , url : "http://openglobus.org/geoserver/" , layers : "topp:states" , opacity : 1.0 , attribution : 'Hi!' , transparentColor : [1.0 , 1.0 , 1.0 ] }); let globus = new og.Globe ({ "target" : "globus" , "name" : "Earth" , "terrain" : new og.terrain .GlobusTerrain (), "layers" : [osm, states] }); globus.planet .flyExtent (states.getExtent ()); </script > </body > </html >
Please click on the following image and have a try.
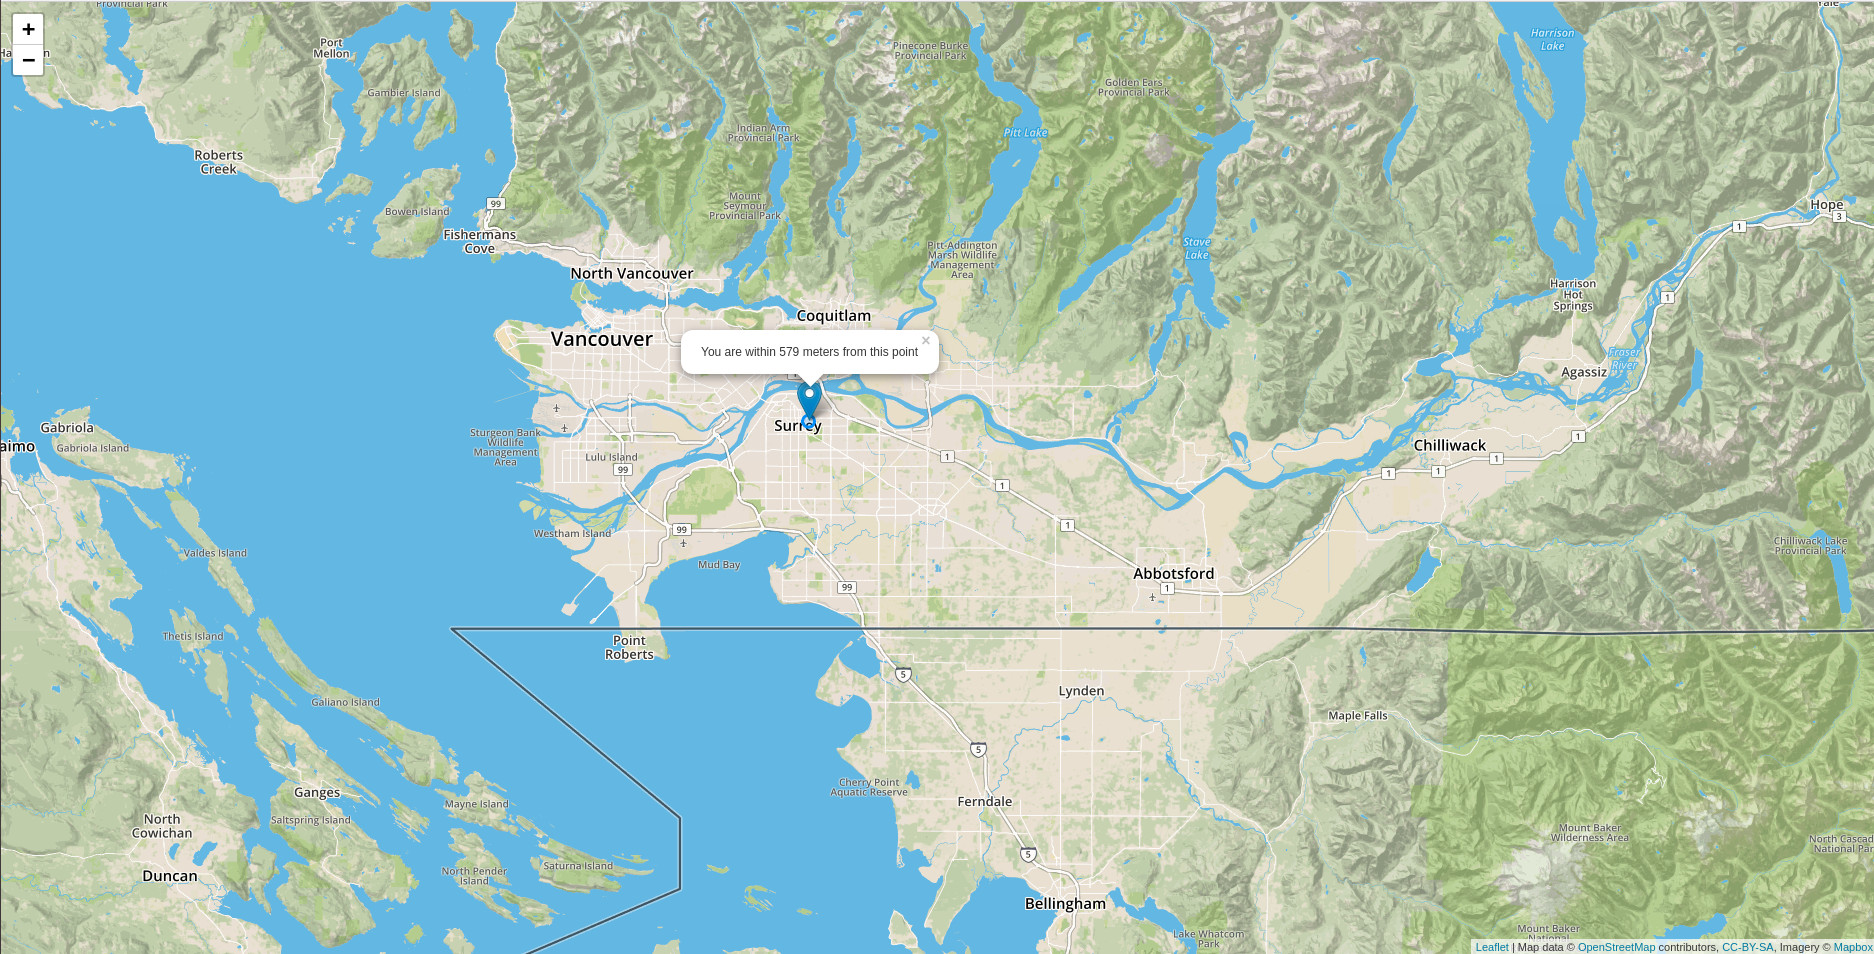
Several LeafletJS examples are given at https://leafletjs.com/examples.html . Here, we took Leaflet on Mobile as an example (code copied).
1 2 3 4 5 6 7 8 9 10 11 12 13 14 15 16 17 18 19 20 21 22 23 24 25 26 27 28 29 30 31 32 33 34 35 36 37 38 39 40 41 42 43 44 45 46 47 48 49 50 51 52 53 54 55 56 57 58 59 60 61 62 63 64 <!DOCTYPE html> <html > <head > <title > Mobile tutorial - Leaflet</title > <meta charset ="utf-8" /> <meta name ="viewport" content ="width=device-width, initial-scale=1.0" > <link rel ="shortcut icon" type ="image/x-icon" href ="docs/images/favicon.ico" /> <link rel ="stylesheet" href ="https://unpkg.com/leaflet@1.3.4/dist/leaflet.css" integrity ="sha512-puBpdR0798OZvTTbP4A8Ix/l+A4dHDD0DGqYW6RQ+9jxkRFclaxxQb/SJAWZfWAkuyeQUytO7+7N4QKrDh+drA==" crossorigin ="" /> <script src ="https://unpkg.com/leaflet@1.3.4/dist/leaflet.js" integrity ="sha512-nMMmRyTVoLYqjP9hrbed9S+FzjZHW5gY1TWCHA5ckwXZBadntCNs8kEqAWdrb9O7rxbCaA4lKTIWjDXZxflOcA==" crossorigin ="" > </script > <style > html , body { height : 100% ; margin : 0 ; } #map { width : 600px ; height : 400px ; } </style > <style > body { padding : 0 ; margin : 0 ; } #map { height : 100% ; width : 100vw ; }</style > </head > <body > <div id ='map' > </div > <script > var map = L.map ('map' ).fitWorld (); L.tileLayer ('https://api.tiles.mapbox.com/v4/{id}/{z}/{x}/{y}.png?access_token=REMOVED_MAPBOX_TOKENeyJ1IjoibWFwYm94IiwiYSI6ImNpejY4NXVycTA2emYycXBndHRqcmZ3N3gifQ.rJcFIG214AriISLbB6B5aw' , { maxZoom : 18 , attribution : 'Map data © <a href="https://www.openstreetmap.org/">OpenStreetMap</a> contributors, ' + '<a href="https://creativecommons.org/licenses/by-sa/2.0/">CC-BY-SA</a>, ' + 'Imagery © <a href="https://www.mapbox.com/">Mapbox</a>' , id : 'mapbox.streets' }).addTo (map); function onLocationFound (e ) { var radius = e.accuracy / 2 ; L.marker (e.latlng ).addTo (map) .bindPopup ("You are within " + radius + " meters from this point" ).openPopup (); L.circle (e.latlng , radius).addTo (map); } function onLocationError (e ) { alert (e.message ); } map.on ('locationfound' , onLocationFound); map.on ('locationerror' , onLocationError); map.locate ({setView : true , maxZoom : 16 }); </script > </body > </html >
Please click on the following image and have a try.
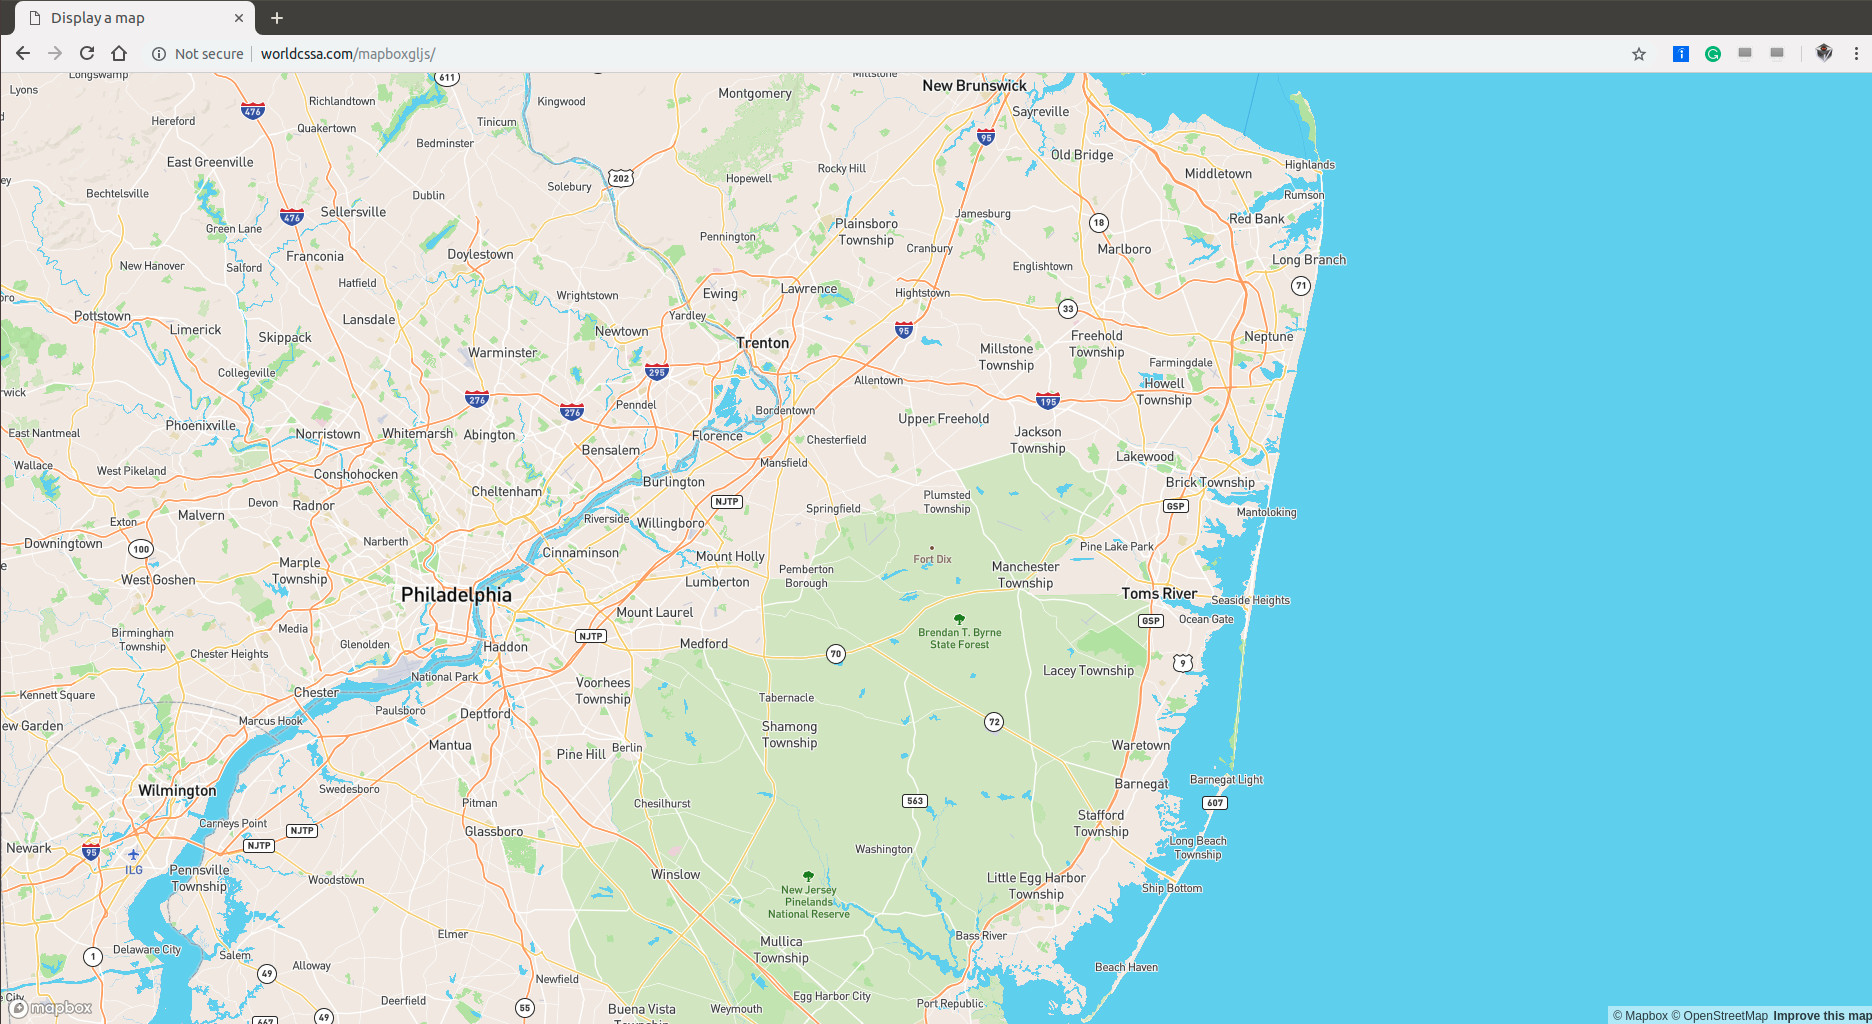
From the above LeafletJS example, it’s clearly show that LeafletJS is based on Mapbox , which is further based on OpenStreetMap . “Mapbox is a Live Location Platform.” (Cited from https://www.mapbox.com/ ).
1 2 3 4 5 6 7 8 9 10 11 12 13 14 15 16 17 18 19 20 21 22 23 24 25 26 27 28 <!DOCTYPE html> <html > <head > <meta charset ='utf-8' /> <title > Display a map</title > <meta name ='viewport' content ='initial-scale=1,maximum-scale=1,user-scalable=no' /> <script src ='https://api.tiles.mapbox.com/mapbox-gl-js/v0.51.0/mapbox-gl.js' > </script > <link href ='https://api.tiles.mapbox.com/mapbox-gl-js/v0.51.0/mapbox-gl.css' rel ='stylesheet' /> <style > body { margin :0 ; padding :0 ; } #map { position :absolute; top :0 ; bottom :0 ; width :100% ; } </style > </head > <body > <div id ='map' > </div > <script > mapboxgl.accessToken = 'REMOVED_MAPBOX_TOKENeyJ1IjoibG9uZ2VydmlzaW9uIiwiYSI6ImNqb2ZpN2Z5ZjA0bnMzd3FoY29oeTZwNW0ifQ.th9s23R3Njgxewe9rDdXzA' ; var map = new mapboxgl.Map ({ container : 'map' , style : 'mapbox://styles/mapbox/streets-v9' , center : [-74.50 , 40 ], zoom : 9 }); </script > </body > </html >
Please click on the following image and have a try.
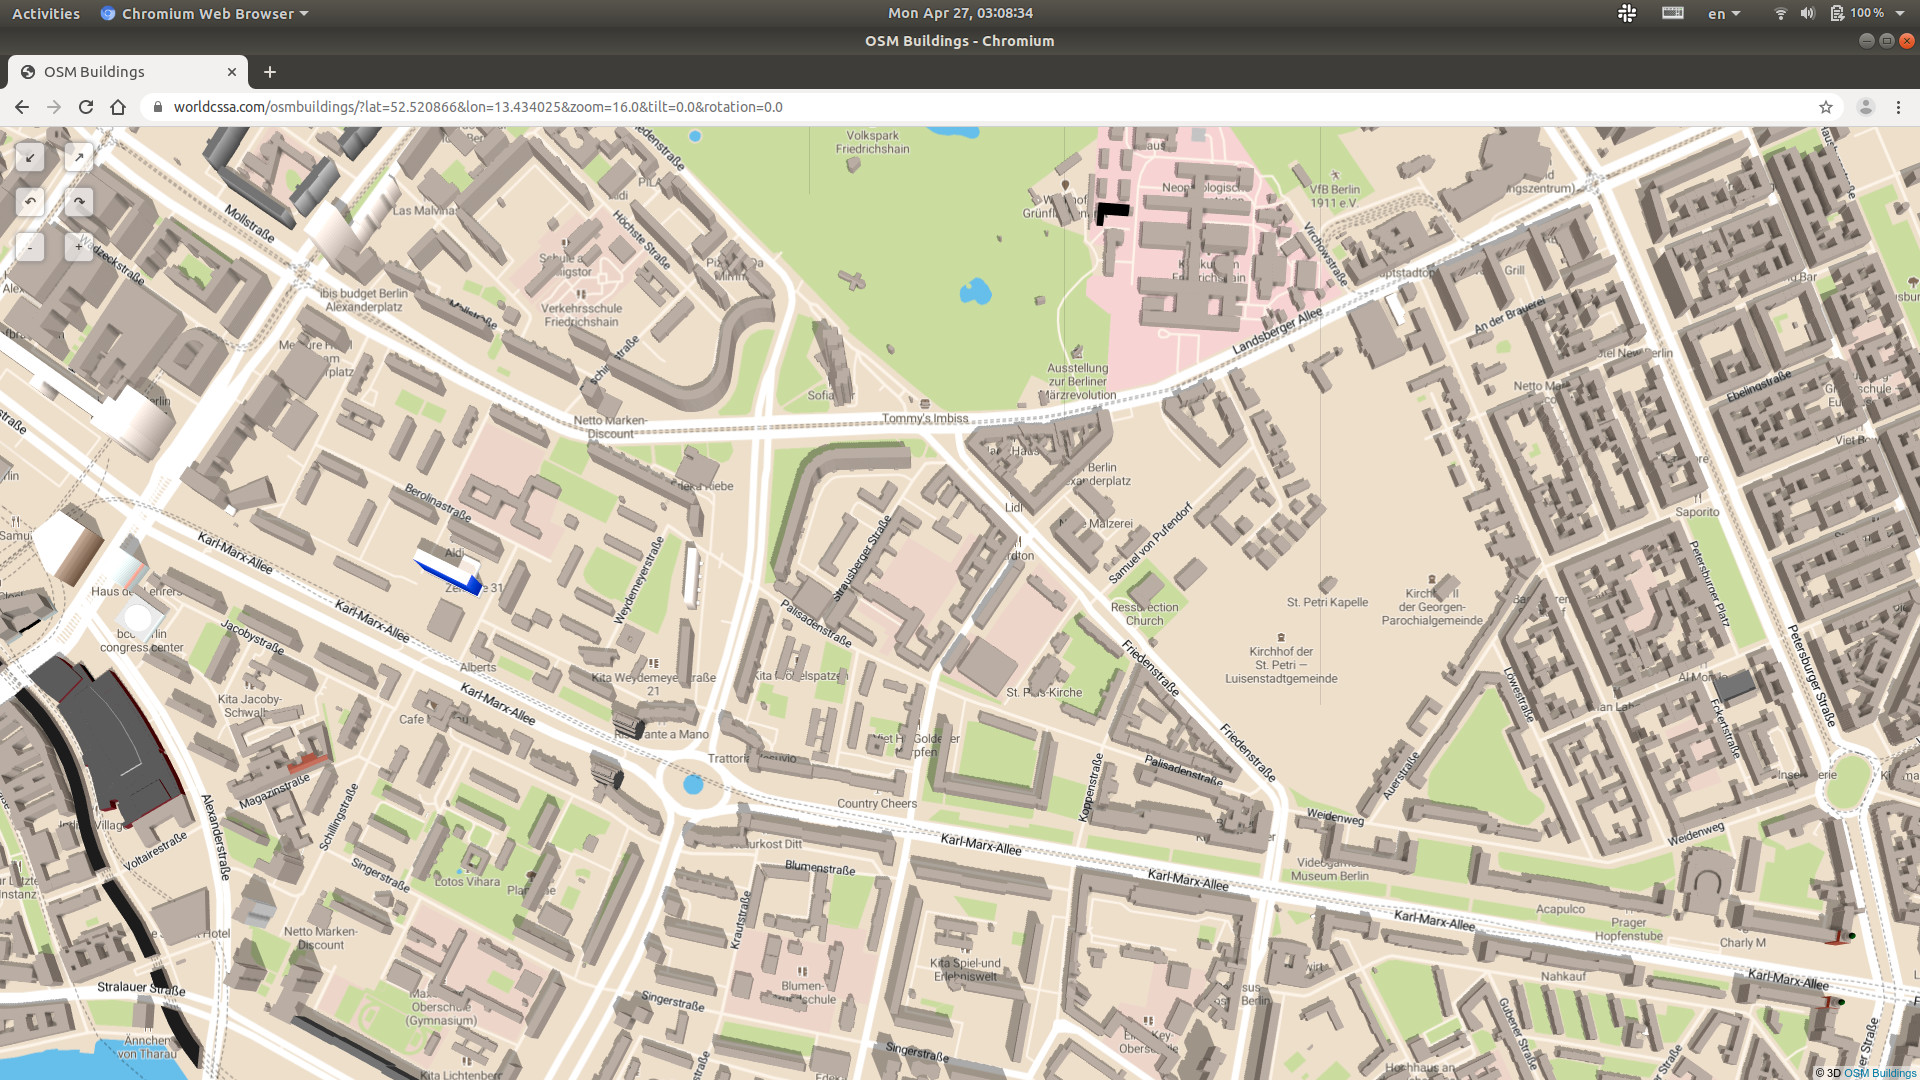
OSMBuildings is “a 3D building geometry viewer based on OpenStreetMap data.” (Cited from https://github.com/OSMBuildings/OSMBuildings ). Unfortunately, from OSMBuildings Registration , it is NOT free. However, its demonstrations are amazing - please refer to https://osmbuildings.org/developer/ .
OpenStreetMap may be covered by different tiles in order to show different maps. For instance, Google map vs Google satellite map . Let’s take a look at Home Page of WebGLEarth , you’ll notice MapTiler at the left bottom corner. Here, we summarize 3 widely used tiles in the following:
Generally, there are the following types of common tiles:
OpenStreetMap vector tilesContour lines vector tiles
Hillshading raster tiles
Landcover vector tiles
Satellite raster tiles
Terrain - quantized mesh tiles
etc.
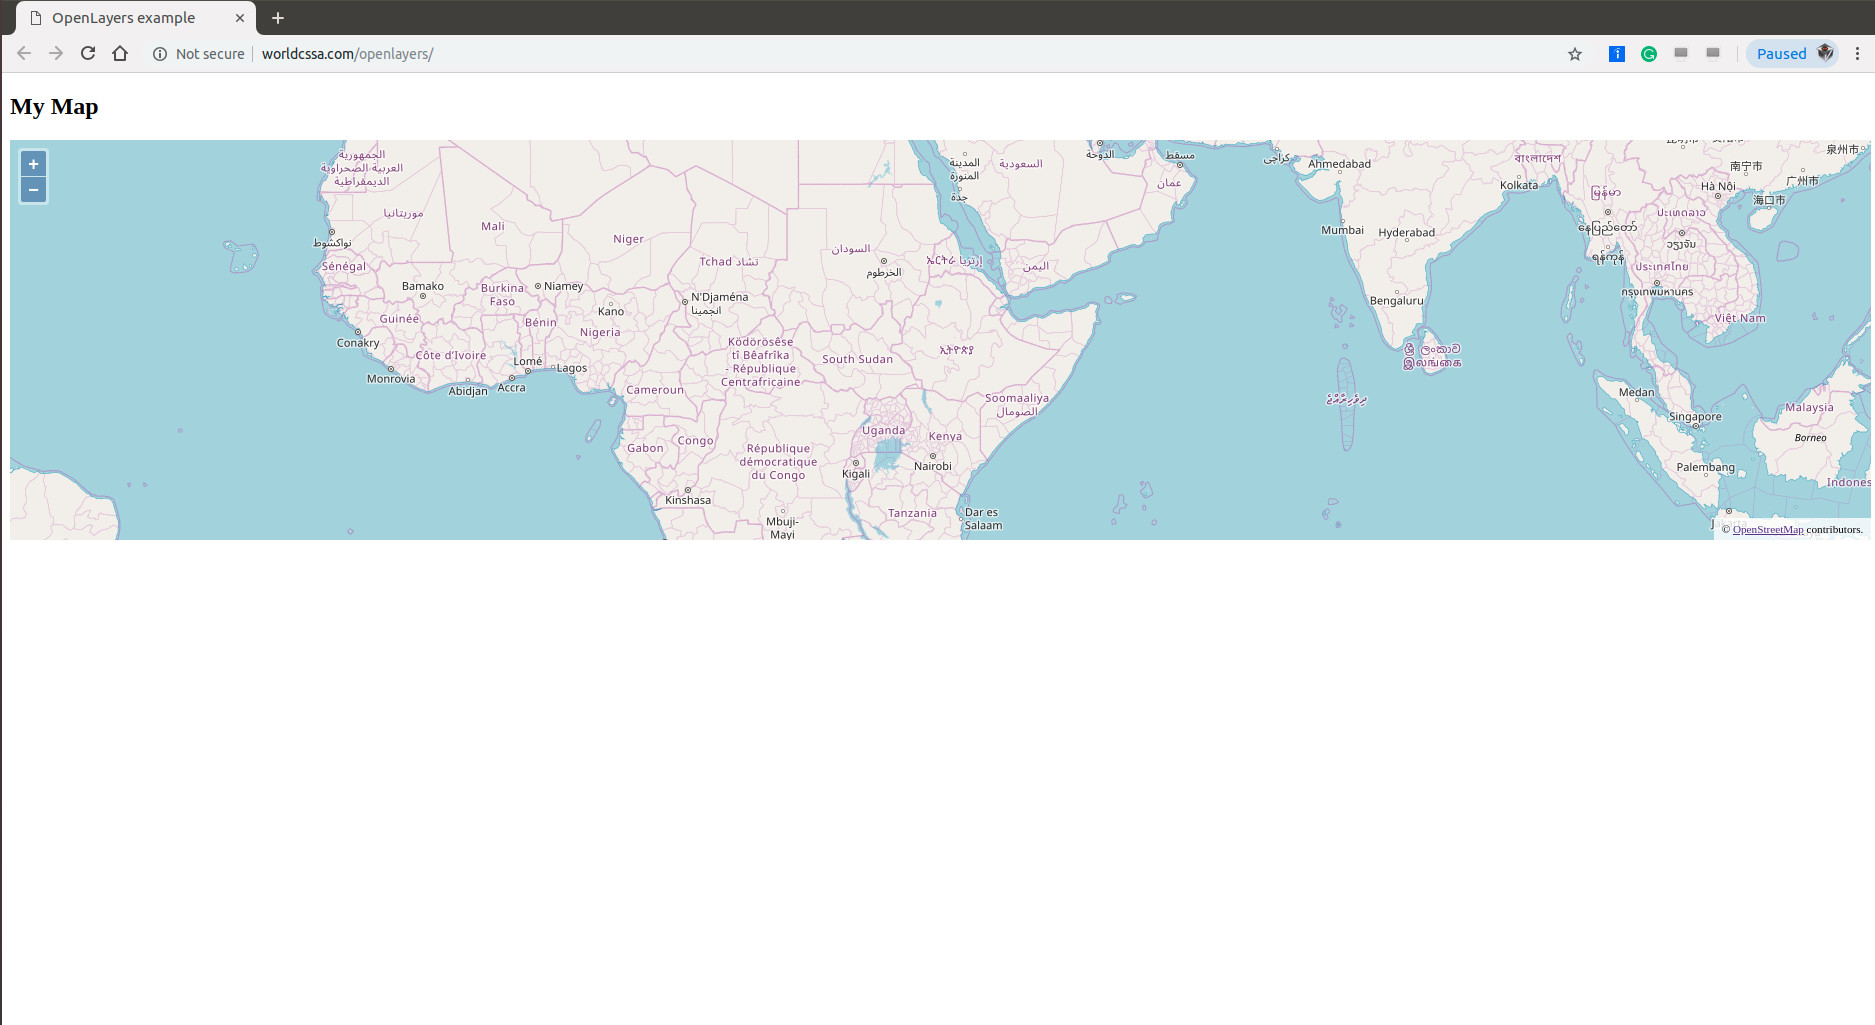
Besides tiles, there might be several layers (including one layer of tile) upon OpenStreetMap , here comes OpenLayers : “OpenLayers makes it easy to put a dynamic map in any web page. It can display map tiles, vector data and markers loaded from any source.” (cited from https://openlayers.org/ )
A simple example of is in OpenLayers QuickStart . The code is cited as:
1
2
3
4
5
6
7
8
9
10
11
12
13
14
15
16
17
18
19
20
21
22
23
24
25
26
27
28
29
30
31
32
<!doctype html> <html lang ="en" > <head > <link rel ="stylesheet" href ="https://cdn.rawgit.com/openlayers/openlayers.github.io/master/en/v5.3.0/css/ol.css" type ="text/css" > <style > .map { height : 400px ; width : 100% ; } </style > <script src ="https://cdn.rawgit.com/openlayers/openlayers.github.io/master/en/v5.3.0/build/ol.js" > </script > <title > OpenLayers example</title > </head > <body > <h2 > My Map</h2 > <div id ="map" class ="map" > </div > <script type ="text/javascript" > var map = new ol.Map ({ target : 'map' , layers : [ new ol.layer .Tile ({ source : new ol.source .OSM () }) ], view : new ol.View ({ center : ol.proj .fromLonLat ([37.41 , 8.82 ]), zoom : 4 }) }); </script > </body > </html >
Please click on the following image and have a try.
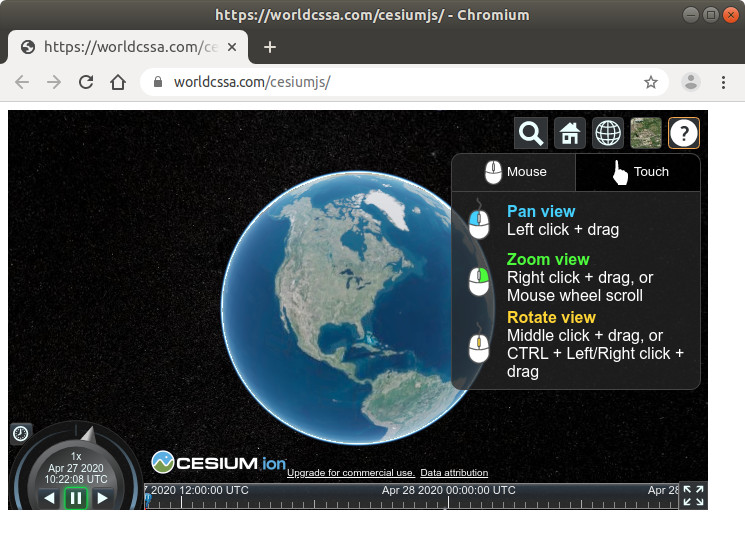
There is a complete example from Cesium Tutorial , which is cited directly as:
1 2 3 4 5 6 7 8 9 10 11 12 13 14 15 16 17 18 19 20 21 22 23 24 <!DOCTYPE html> <html lang="en"> <head> <meta charset="utf-8"> <script src="https://cesium.com/downloads/cesiumjs/releases/1.68/Build/Cesium/Cesium.js"></script> <link href="https://cesium.com/downloads/cesiumjs/releases/1.68/Build/Cesium/Widgets/widgets.css" rel="stylesheet"> </head> <body> <div id="cesiumContainer" style="width: 700px; height:400px"></div> <script> Cesium.Ion.defaultAccessToken = 'REMOVED_CESIUM_TOKENIsInR5cCI6IkpXVCJ9.eyJqdGkiOiI1ZTcwZTRmMS1jNmZkLTQ1NzctYTU3ZC03Mzc1Y2U2YWU5OTMiLCJpZCI6MjY1MzUsInNjb3BlcyI6WyJhc3IiLCJnYyJdLCJpYXQiOjE1ODc5MDM0MDB9.SAx2MQ2F3mUmH2InfoHWJvUoQBhq1CvGwo_2Z8oNC7Y'; var viewer = new Cesium.Viewer('cesiumContainer', { terrainProvider: Cesium.createWorldTerrain() }); var tileset = viewer.scene.primitives.add( new Cesium.Cesium3DTileset({ url: Cesium.IonResource.fromAssetId(your_asset_id) }) ); viewer.zoomTo(tileset); </script> </body> </html>
You are welcome to click on the following image and have a try.
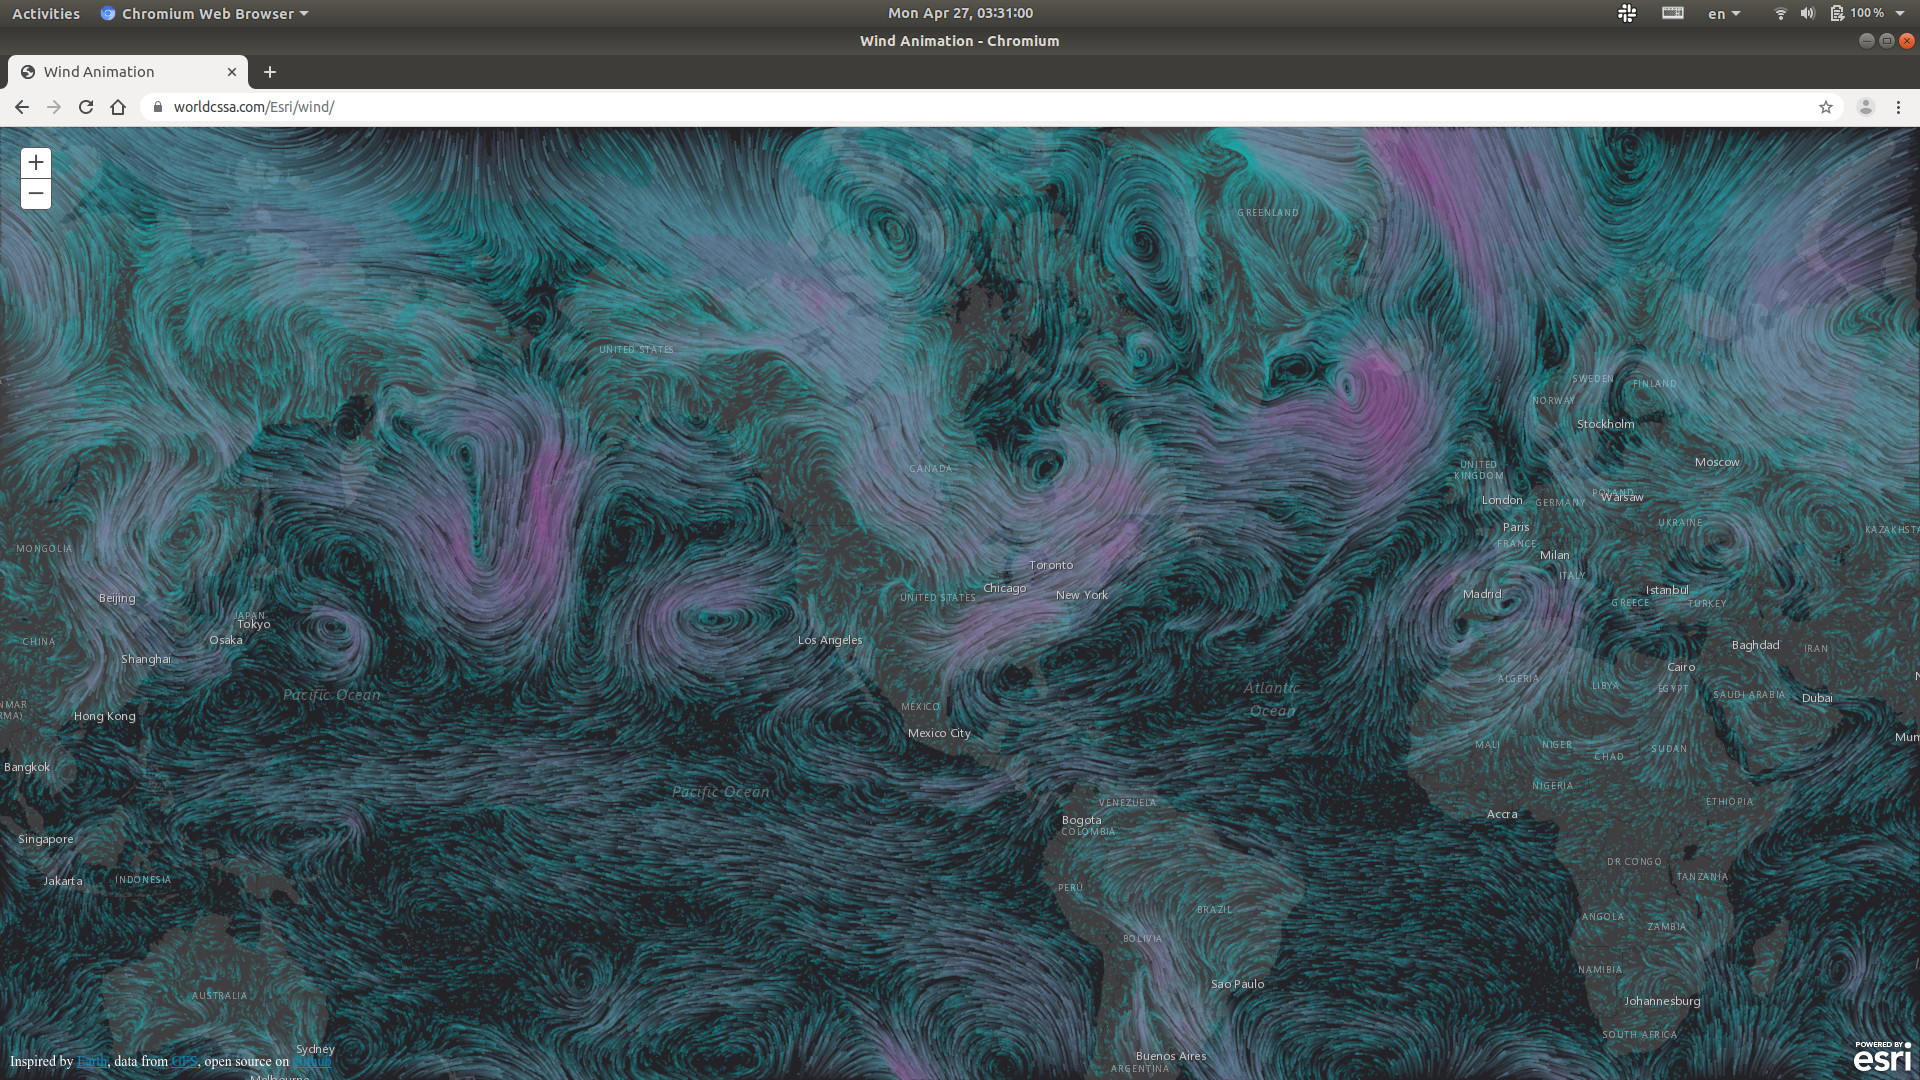
As the LAST A Live Demo - Wind-JS
VIDEO
You are of course welcome to click on the following image and have a try:
MapQuest provides Open Search (Nominatim) API , which relies solely on OpenStreetMap data.
Geocoding based on OpenStreetMap is exactly for ME .
😍
Several Geocoding services are provided as follows:
Please take a look at the bottom of my other website https://longervision.cc/ .