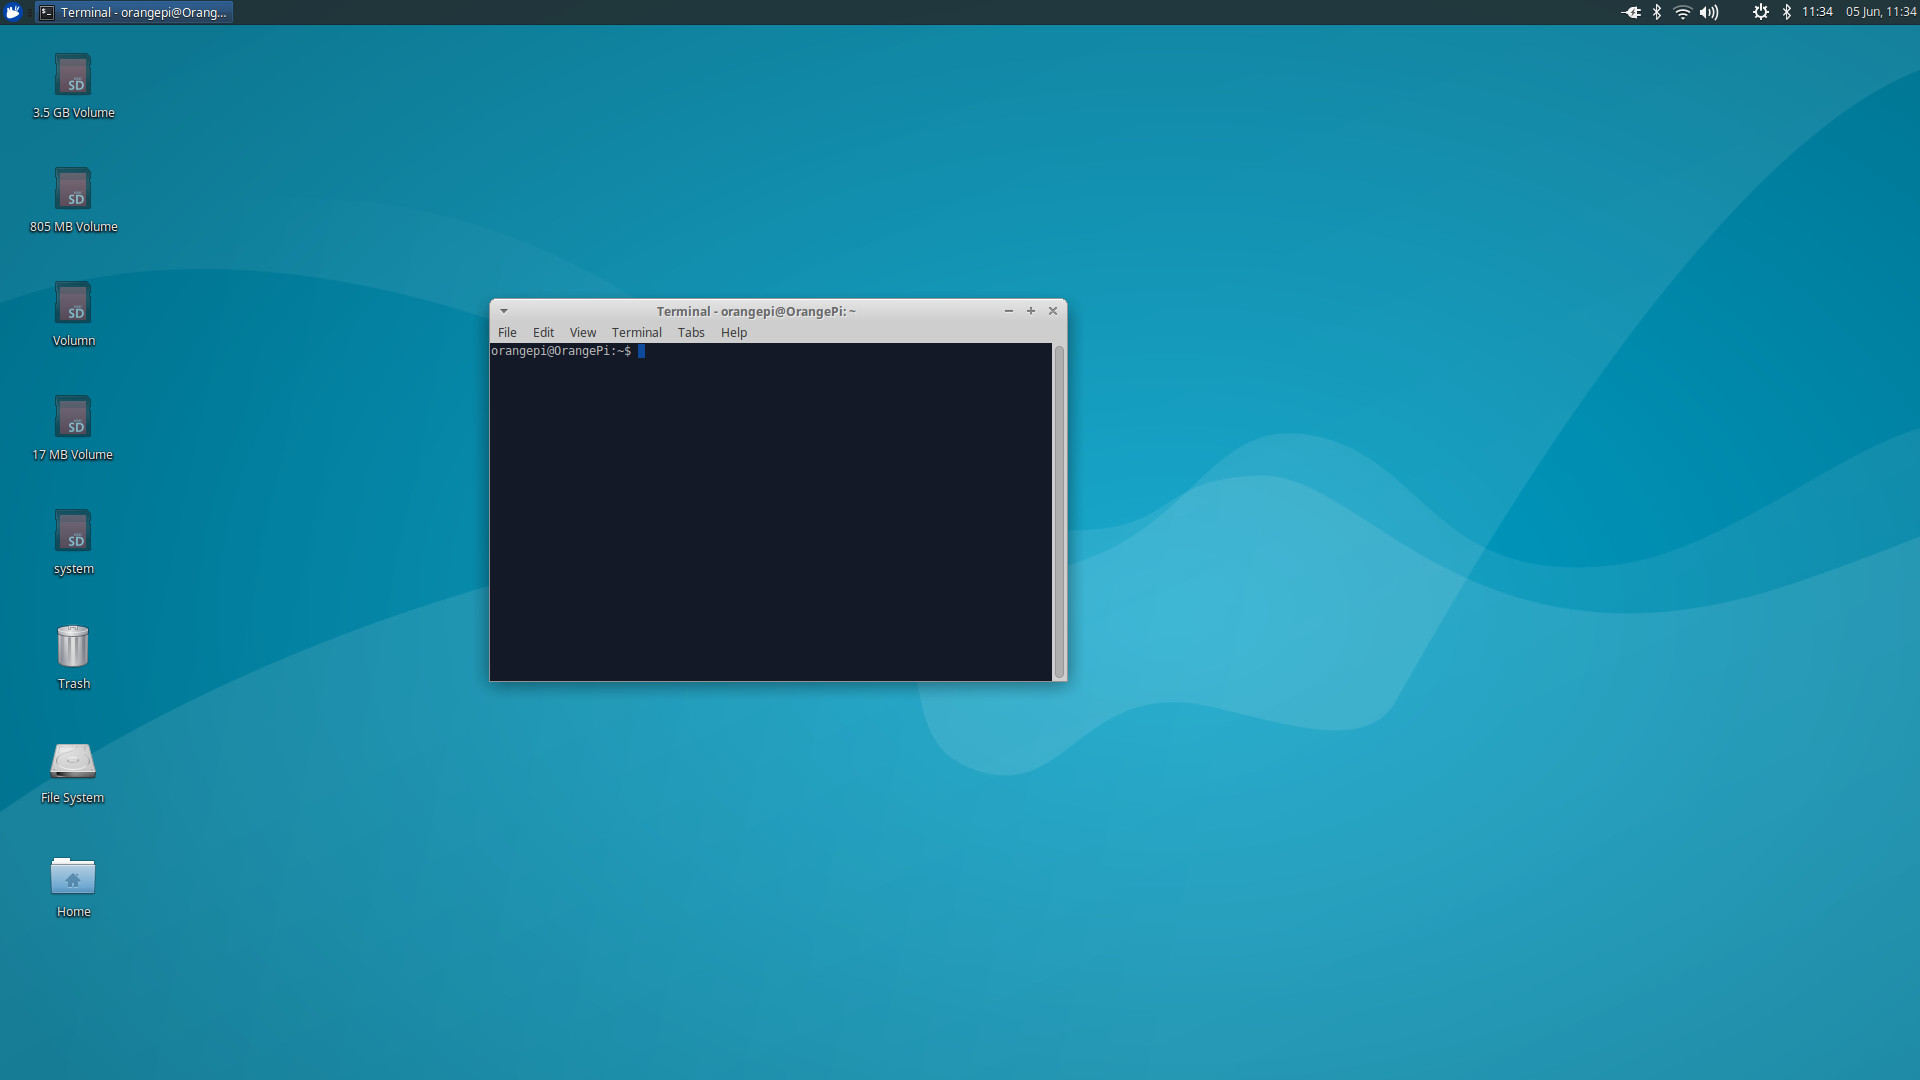
The overview of Official Orange Pi’s Ubuntu Desktop for Orange Pi 3 looks as:
2. Kernel Doublechecking
1 2 3 4 5 6 7 8 9 10
orangepi@OrangePi:~$ uname -r 4.9.118+ orangepi@OrangePi:~$ uname -a Linux OrangePi 4.9.118+ #5 SMP PREEMPT Mon Apr 15 09:45:02 CST 2019 aarch64 aarch64 aarch64 GNU/Linux orangepi@OrangePi:~$ lsb_release -a No LSB modules are available. Distributor ID: Ubuntu Description: Ubuntu 16.04.6 LTS Release: 16.04 Codename: xenial
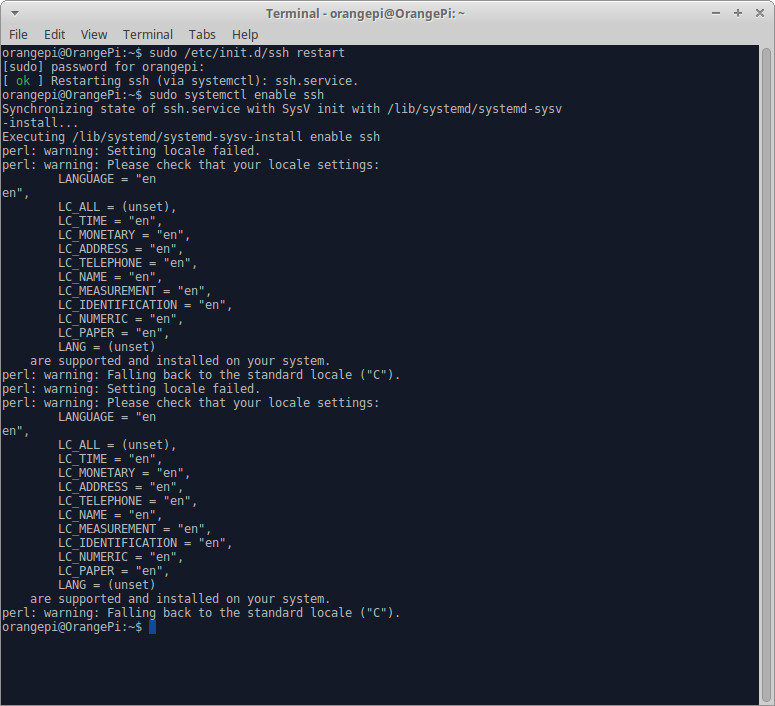
3. Enable SSH
After having successfully enabled SSH, you are able to login Orange Pi 3 remotely. Well, you may still need to figure out how to:
setup Wifi for Orange Pi 3, which is pretty simple with Ubuntu Desktop GUI
further setup static IP addresses in your router for both Wifi and Wired connections
4. Update & Upgrade
1 2 3 4 5 6 7 8 9 10 11
orangepi@OrangePi:~$ sudo apt update [sudo] password for orangepi: Hit:1 http://mirrors.tuna.tsinghua.edu.cn/ubuntu-ports xenial InRelease Hit:2 http://mirrors.tuna.tsinghua.edu.cn/ubuntu-ports xenial-updates InRelease Hit:3 http://mirrors.tuna.tsinghua.edu.cn/ubuntu-ports xenial-backports InRelease Hit:4 http://mirrors.tuna.tsinghua.edu.cn/ubuntu-ports xenial-security InRelease Reading package lists... Done Building dependency tree Reading state information... Done All packages are up to date. root@orangepi3:~#
Since I’ve already updated/upgraded all packages, it’ll tell you from terminal that All packages are up to date.. BTW, it seems Orange Pi is a team from TsingHua Universiity?
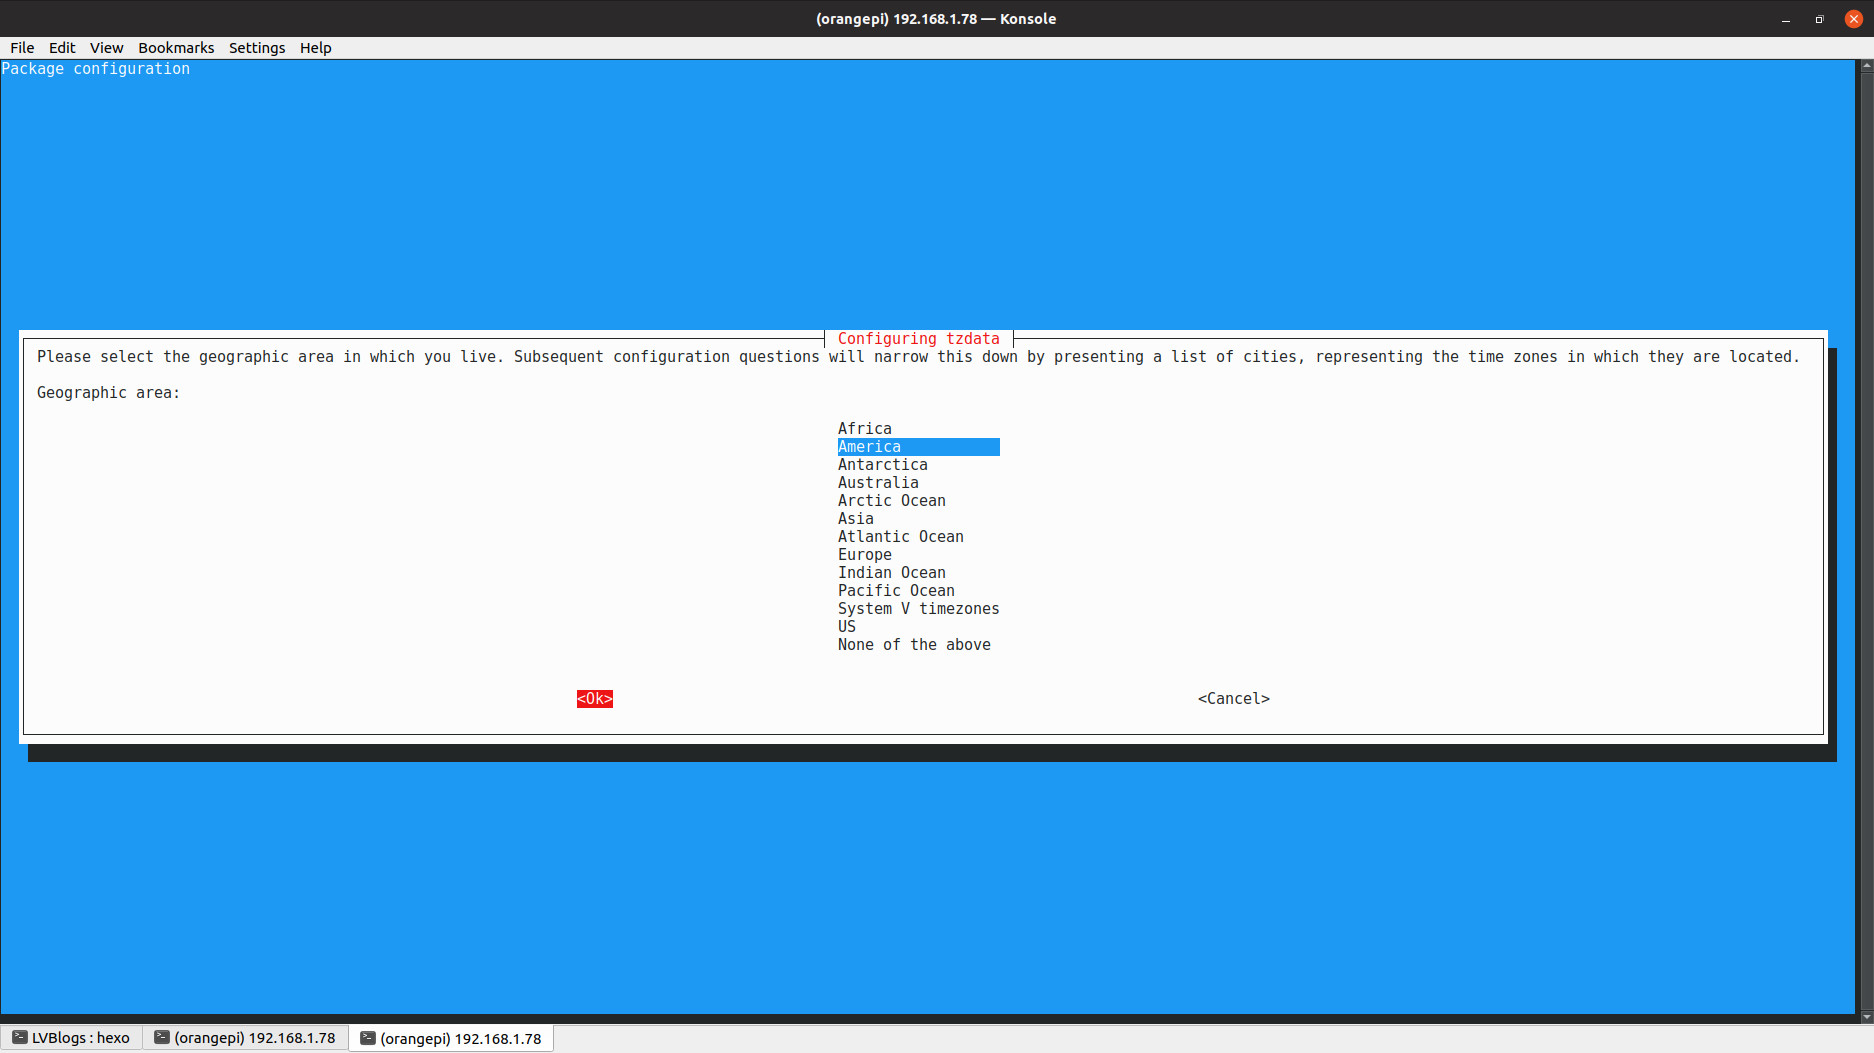
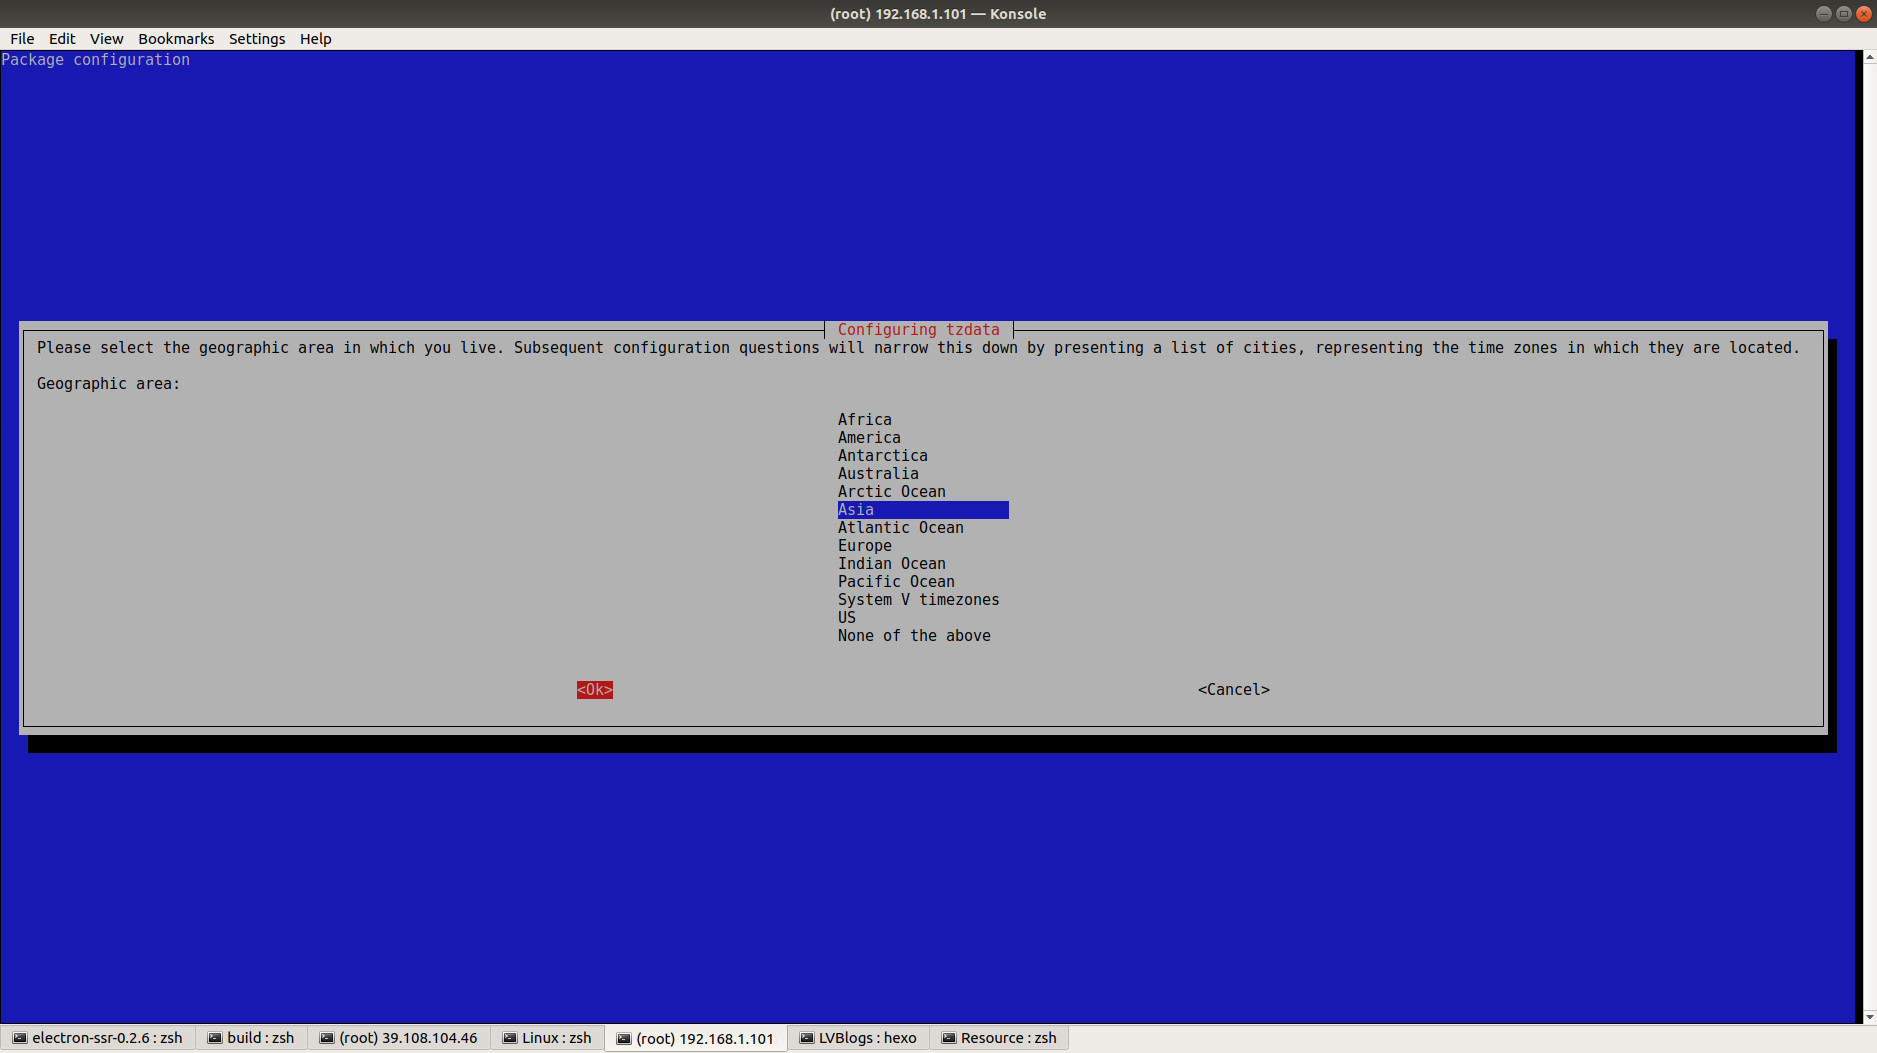
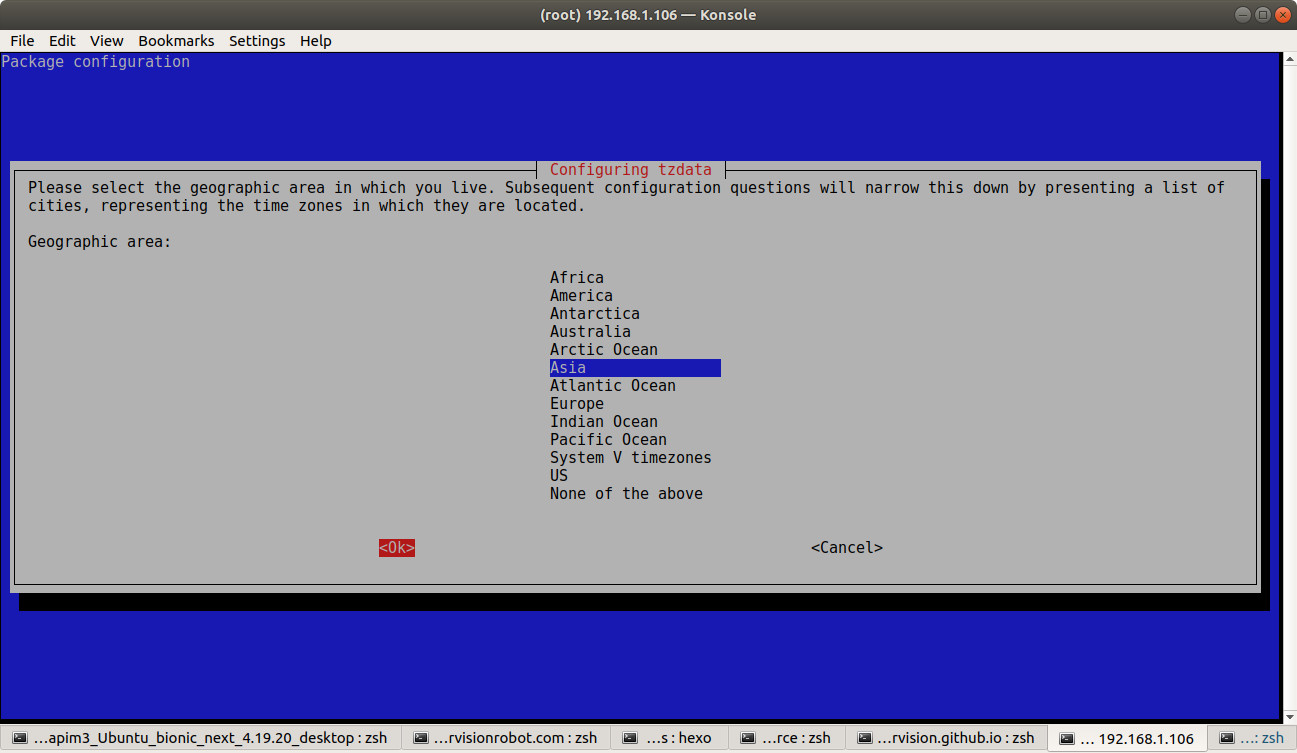
orangepi@OrangePi:~$ sudo dpkg-reconfigure tzdata perl: warning: Setting locale failed. perl: warning: Please check that your locale settings: LANGUAGE = (unset), LC_ALL = (unset), LC_PAPER = "en", LC_ADDRESS = "en", LC_MONETARY = "en", LC_NUMERIC = "en", LC_TELEPHONE = "en", LC_IDENTIFICATION = "en", LC_MEASUREMENT = "en", LC_CTYPE = "en_CA.UTF-8", LC_TIME = "en", LC_NAME = "en", LANG = "en_CA.UTF-8" are supported and installed on your system. perl: warning: Falling back to the standard locale ("C"). locale: Cannot set LC_CTYPE to default locale: No such file or directory locale: Cannot set LC_MESSAGES to default locale: No such file or directory locale: Cannot set LC_ALL to default locale: No such file or directory /usr/bin/locale: Cannot set LC_CTYPE to default locale: No such file or directory /usr/bin/locale: Cannot set LC_MESSAGES to default locale: No such file or directory /usr/bin/locale: Cannot set LC_ALL to default locale: No such file or directory
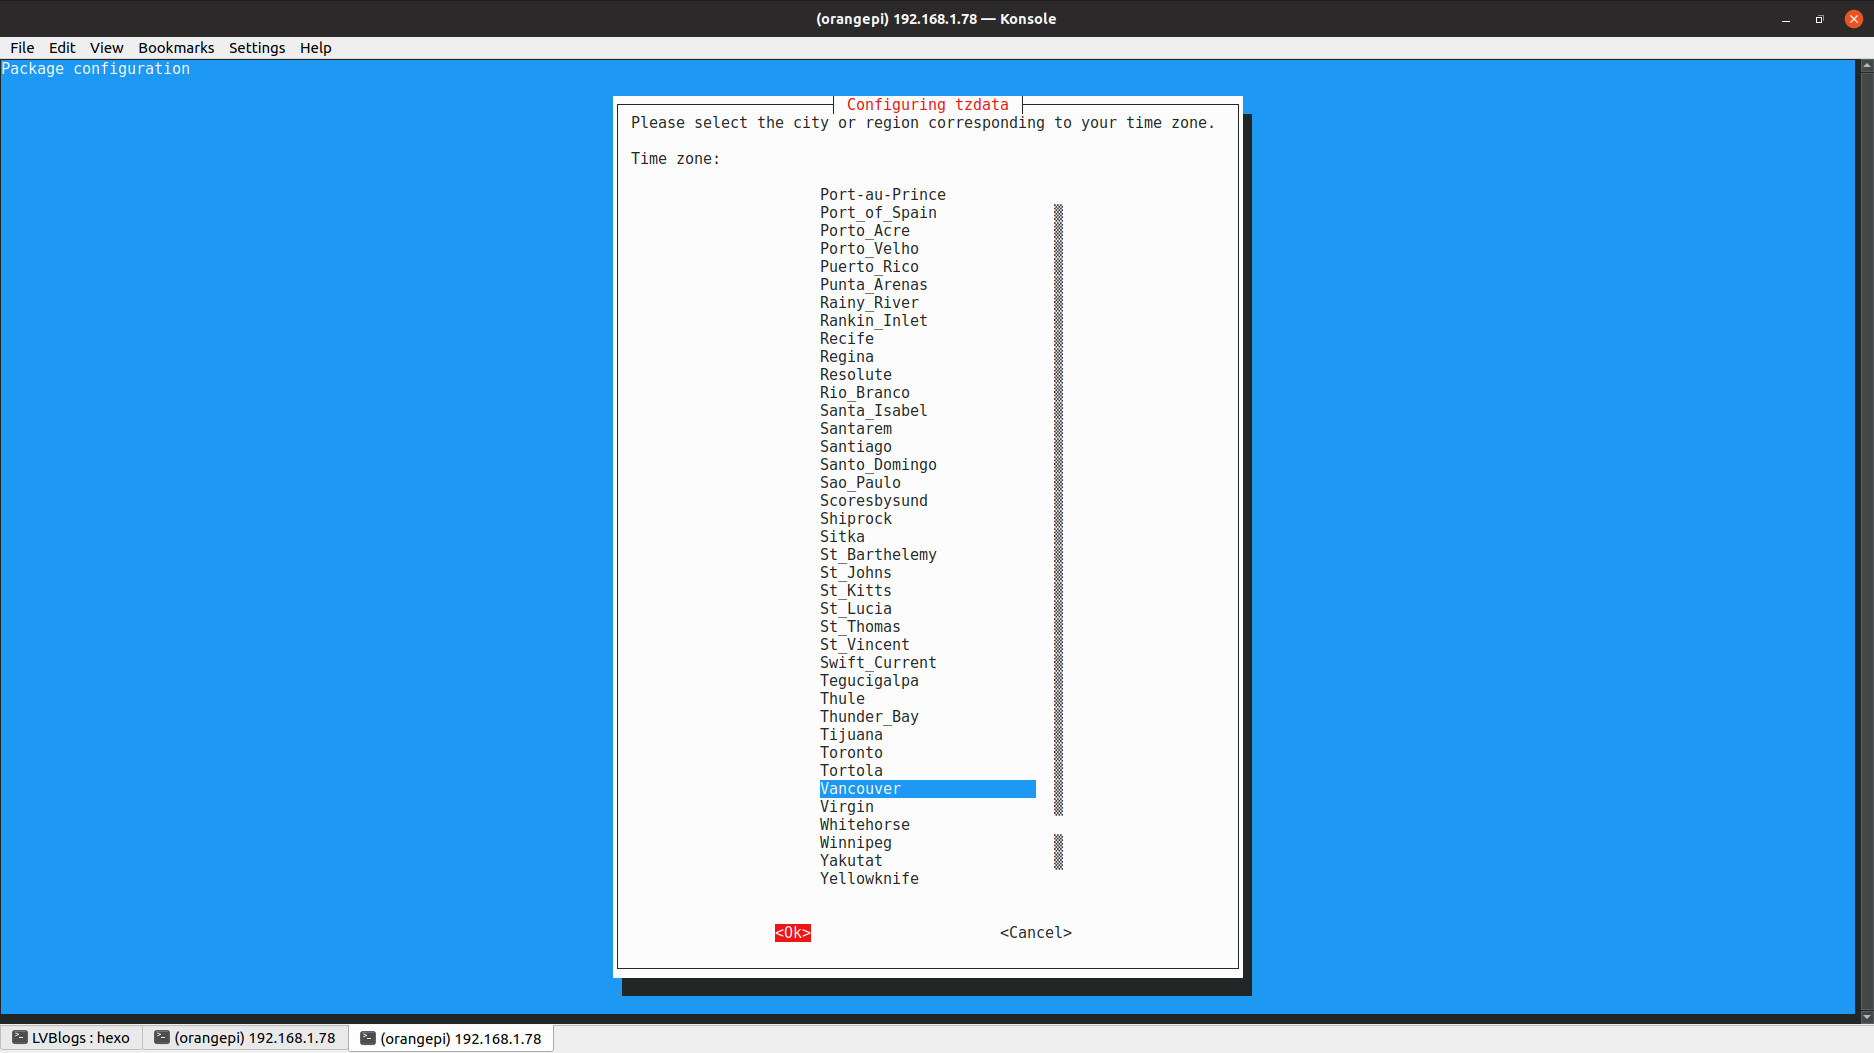
Current default time zone: 'America/Vancouver' Local time is now: Wed Jun 5 09:43:12 PDT 2019. Universal Time is now: Wed Jun 5 16:43:12 UTC 2019.
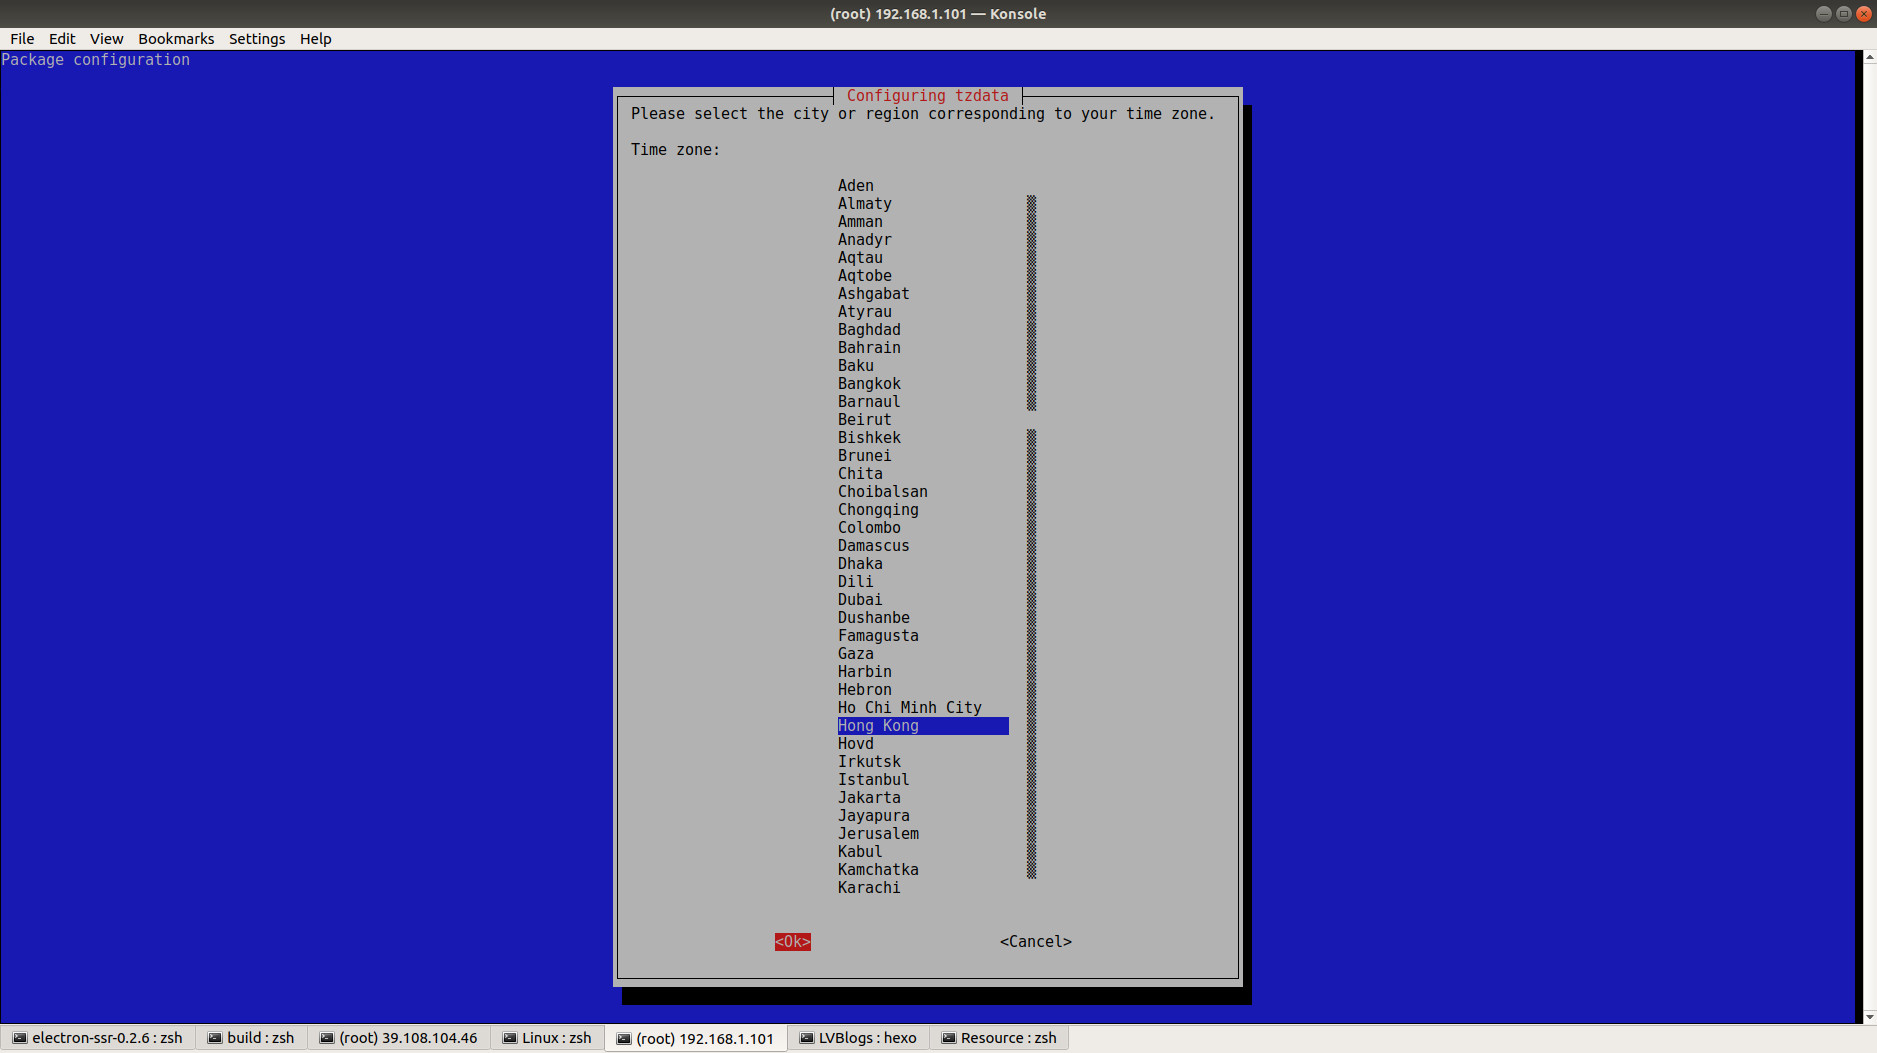
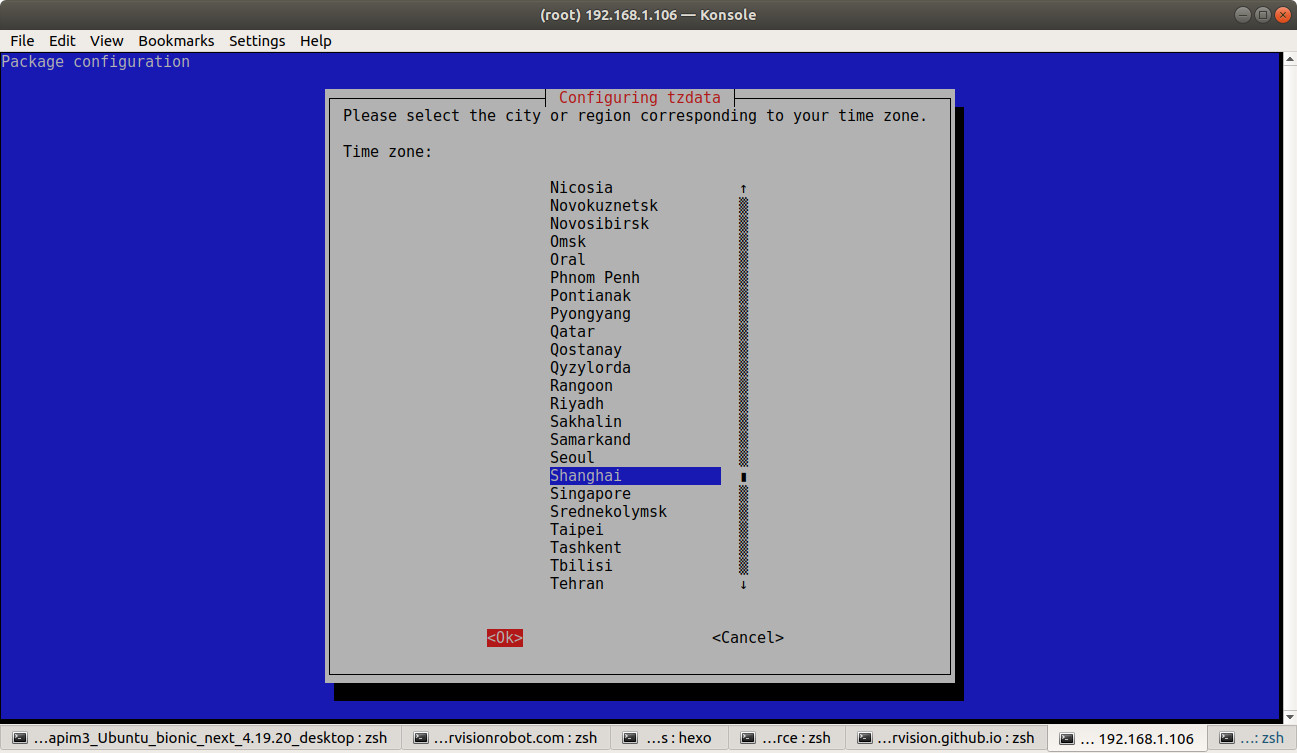
During the above process, you’ll set the following 2 pages correspondingly:
By using the command date, we can see the timezone has been successfully reset.
1 2
orangepi@OrangePi:~# date Wed Jun 5 12:05:40 PDT 2019
For the 1st time, we successfully had distro-info, Markdown, Pygments, PyGObject installed, but failed to install pycups. For the 2nd time, after libcups2-dev had been installed from Ubuntu repository, we had pycups installed successfully.
However, we still have one LAST issue: why distro-info is still oudated? ^_^ Can anybody give me an explanation?
Skill 2 - How to list all auto-removable packages?
➜ ~ nmap -sP 192.168.1.254/24 Starting Nmap 7.70 ( https://nmap.org ) at 2019-06-03 08:03 PDT Nmap scan report for 192.168.1.64 Host is up (0.082s latency). Nmap scan report for 192.168.1.65 Host is up (0.0092s latency). Nmap scan report for 192.168.1.66 Host is up (0.010s latency). Nmap scan report for 192.168.1.67 Host is up (0.037s latency). Nmap scan report for 192.168.1.71 Host is up (0.032s latency). Nmap scan report for 192.168.1.73 Host is up (0.032s latency). Nmap scan report for 192.168.1.74 Host is up (0.061s latency). Nmap scan report for 192.168.1.98 Host is up (0.044s latency). Nmap scan report for 192.168.1.103 Host is up (0.15s latency). Nmap scan report for lvision-GT72-6QE (192.168.1.200) Host is up (0.00047s latency). Nmap scan report for _gateway (192.168.1.254) Host is up (0.015s latency). Nmap done: 256 IP addresses (11 hosts up) scanned in 8.21 seconds ➜ ~
12 ✔ python 4s ~/.local/lib/python3.6/site-packages Python 3.6.9 (default, Jul 17 2020, 12:50:27) [GCC 8.4.0] on linux Type "help", "copyright", "credits" or "license" for more information. >>> from pathlib import Path >>> print(Path().read_text) Traceback (most recent call last): File "<stdin>", line 1, in <module> AttributeError: 'PosixPath' object has no attribute 'read_text'
Skill 15 - Run gdb with user root
Create a script called gdb in e.g. my home directory, containing: pkexec /usr/bin/gdb "$@"
make it executable
modify the launch.json in VSCode to call the script (obviously change username accordingly) by adding miDebuggerPath:
➜ pip list --outdated WARNING: pip is being invoked by an old script wrapper. This will fail in a future version of pip. Please see https://github.com/pypa/pip/issues/5599 for advice on fixing the underlying issue. To avoid this problem you can invoke Python with '-m pip' instead of running pip directly.
Therefore, python -m pip is used instead:
1 2 3
➜ bin python -m pip list --outdated ➜ bin python -m pip --version pip 21.3.1 from /home/jetbot/.local/lib/python3.6/site-packages/pip (python 3.6)
Skill 18 - HOWTO – Resize partitions in raw disk (dd) image files (.img)
➜ myWebsite git:(master) git push Enumerating objects: 1498, done. Counting objects: 100% (1498/1498), done. Delta compression using up to 48 threads Compressing objects: 100% (1227/1227), done. Writing objects: 100% (1498/1498), 1.20 MiB | 10.40 MiB/s, done. Total 1498 (delta 182), reused 0 (delta 0), pack-reused 0 remote: Resolving deltas: 100% (182/182), done. remote: error: refusing to update checked out branch: refs/heads/master remote: error: By default, updating the current branch in a non-bare repository remote: is denied, because it will make the index and work tree inconsistent remote: with what you pushed, and will require 'git reset --hard' to match remote: the work tree to HEAD. remote: remote: You can set the 'receive.denyCurrentBranch' configuration variable remote: to 'ignore' or 'warn' in the remote repository to allow pushing into remote: its current branch; however, this is not recommended unless you remote: arranged to update its work tree to match what you pushed in some remote: other way. remote: remote: To squelch this message and still keep the default behaviour, set remote: 'receive.denyCurrentBranch' configuration variable to 'refuse'. To XXX.XXX.XXX.XXX:~/myWebsite.git ! [remote rejected] master -> master (branch is currently checked out) error: failed to push some refs to 'XXX.XXX.XXX.XXX:~/myWebsite.git'
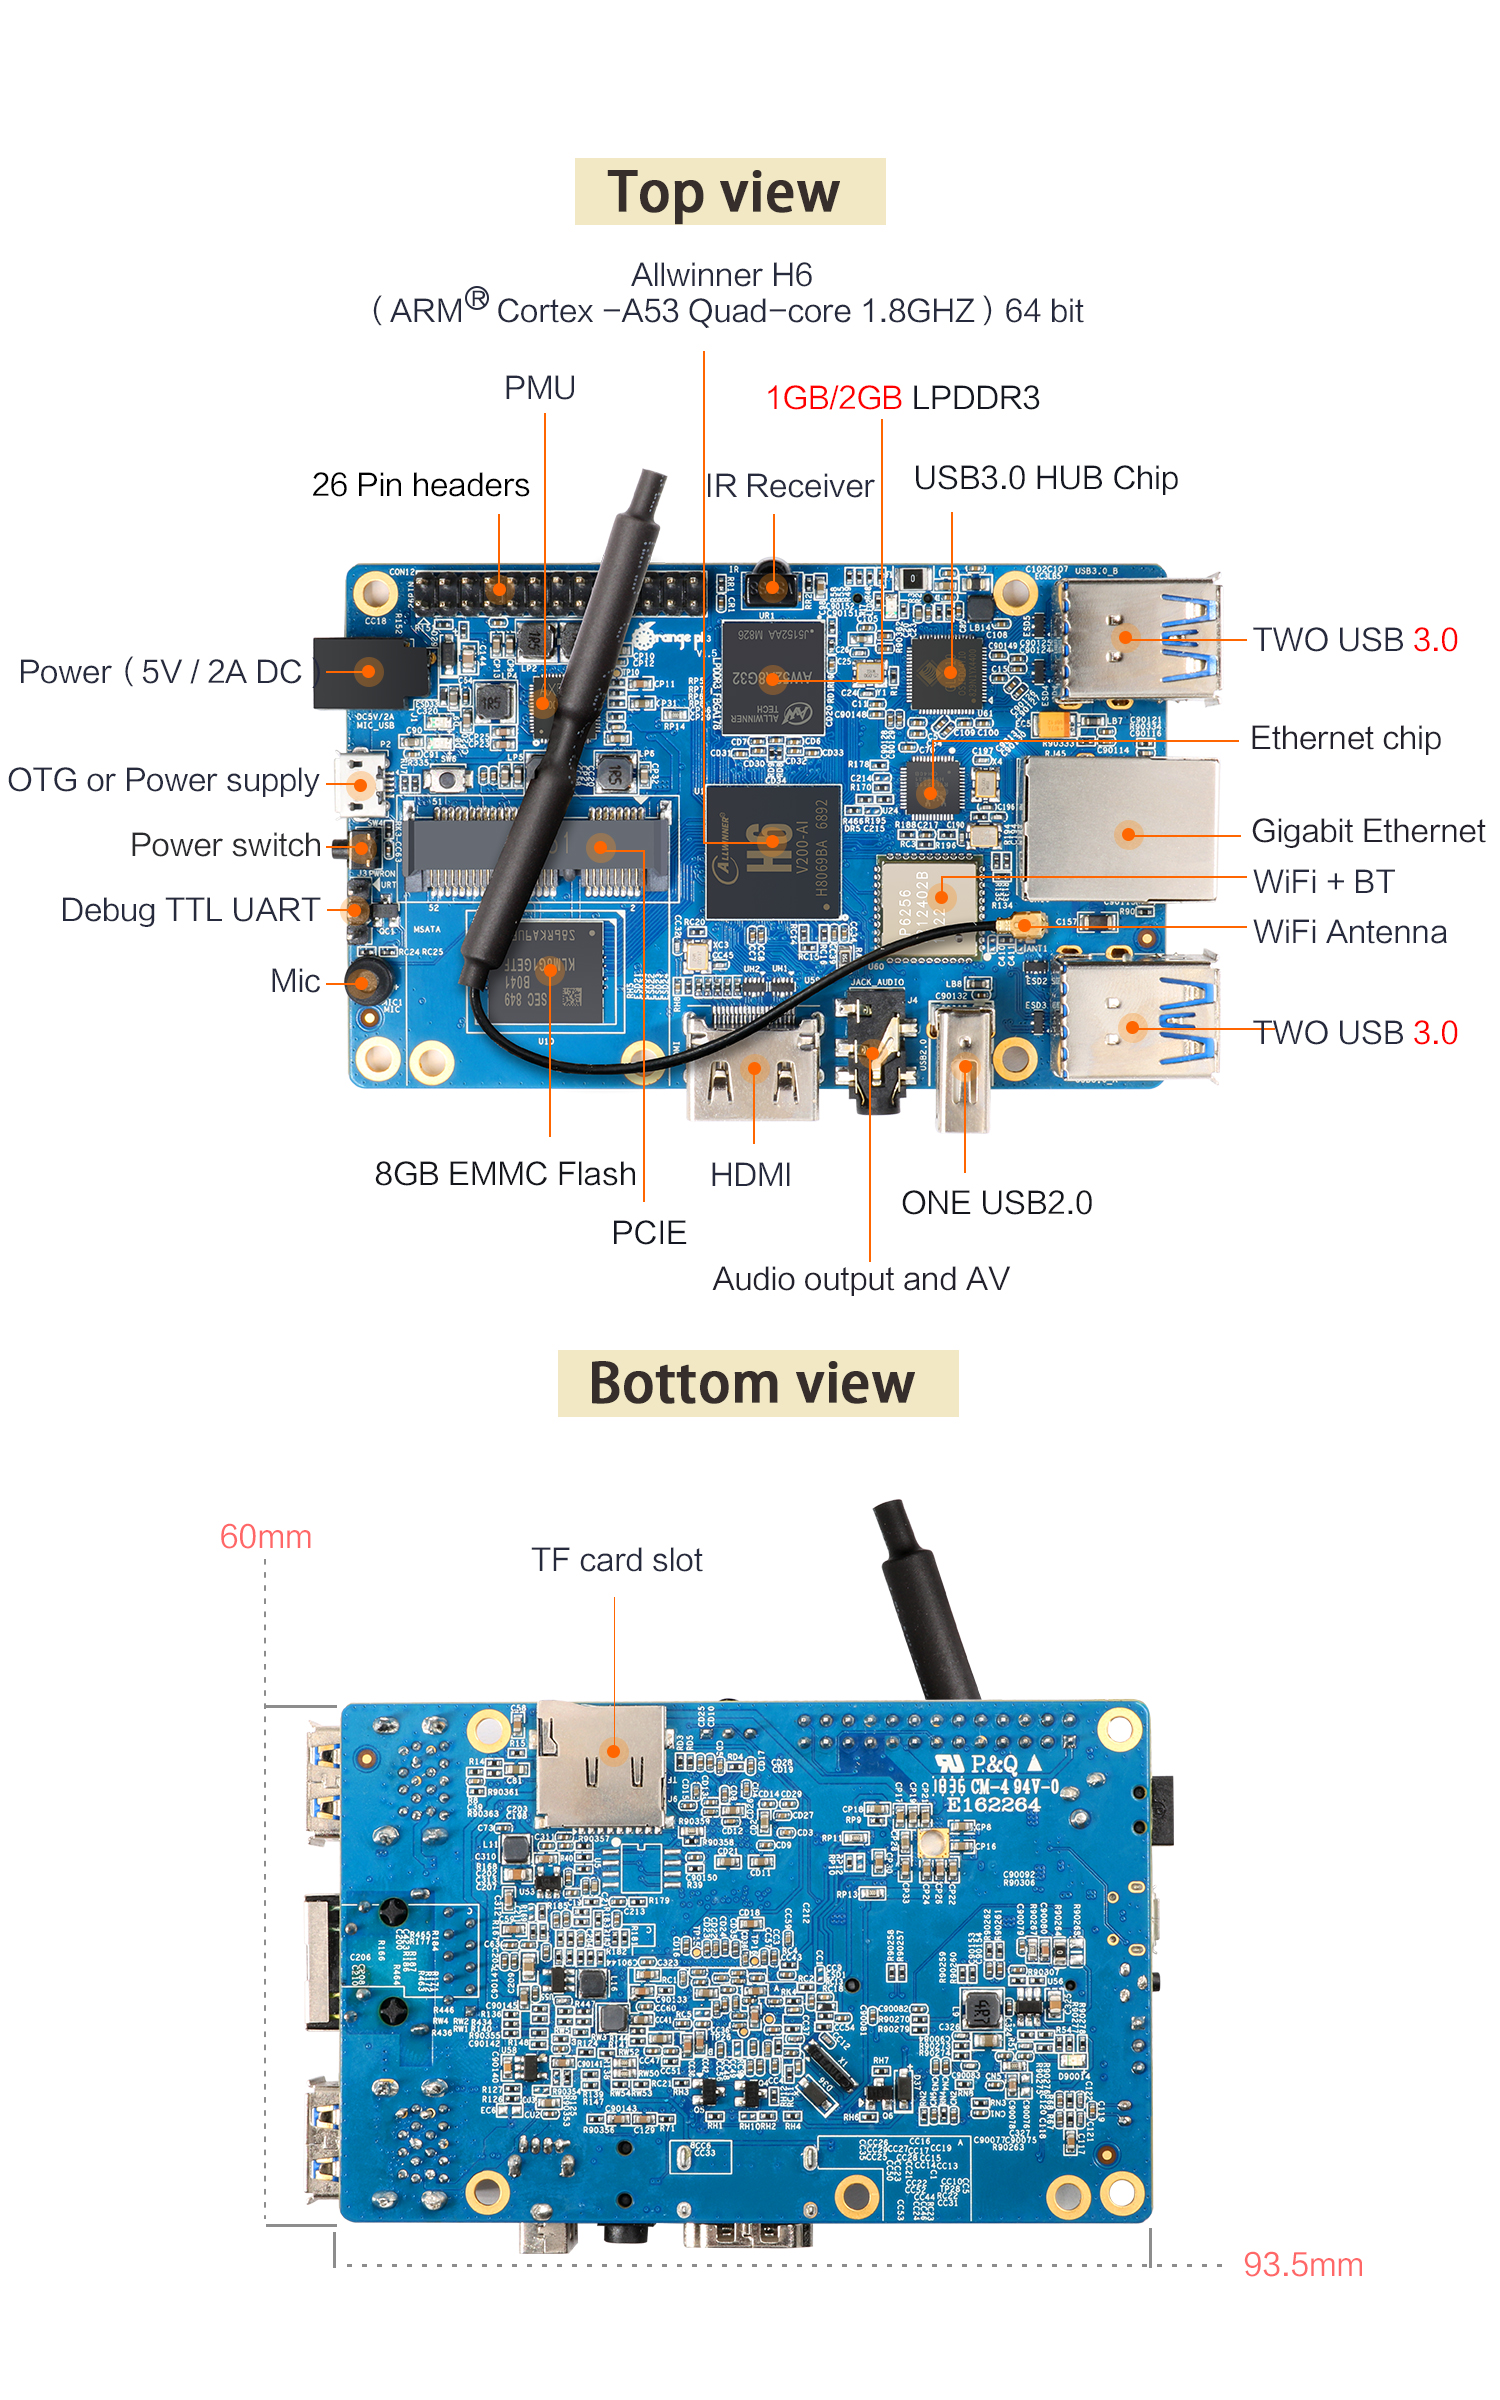
PART A: Install Ubuntu Desktop Nightly Built By Armbian onto Orange Pi 3
1. Download Armbian Ubuntu Desktop for Orange Pi 3
We FIRST go visiting the website https://dl.armbian.com/orangepi3/nightly/ and click on the LAST link, for today May 12, 2019, a file named Armbian_5.86.190512_Orangepi3_Ubuntu_bionic_dev_5.1.0.7z will be automatically downloaded.
➜ ~ ssh root@192.168.1.101 root@192.168.1.101's password: You are required to change your password immediately (root enforced) ___ ____ _ _____ / _ \ _ __ __ _ _ __ __ _ ___ | _ \(_) |___ / | | | | '__/ _` | '_ \ / _` |/ _ \ | |_) | | |_ \ | |_| | | | (_| | | | | (_| | __/ | __/| | ___) | \___/|_| \__,_|_| |_|\__, |\___| |_| |_| |____/ |___/ Welcome to ARMBIAN 5.86.190512 nightly Ubuntu 18.04.2 LTS 5.1.0-sunxi64 System load: 0.01 0.13 0.08 Up time: 5 min Memory usage: 4 % of 1997MB IP: 192.168.1.101 CPU temp: 40°C Usage of /: 3% of 29G Last login: Mon May 13 08:59:30 2019 from 192.168.1.11 Changing password for root. (current) UNIX password: Enter new UNIX password: Retype new UNIX password: You are using an Armbian nightly build meant only for developers to provide constructive feedback to improve build system, OS settings or user experience. If this does not apply to you, STOP NOW!. Especially don't use this image for daily work since things might not work as expected or at all and may break anytime with next update. YOU HAVE BEEN WARNED!
This image is provided AS IS with NO WARRANTY and NO END USER SUPPORT!.
Creating a new user account. Press <Ctrl-C> to abort
Please provide a username (eg. your forename): Sky Trying to add user sky Adding user `sky' ... Adding new group `sky' (1000) ... Adding new user `sky' (1000) with group `sky' ... Creating home directory `/home/sky' ... Copying files from `/etc/skel' ... Enter new UNIX password: Retype new UNIX password: passwd: password updated successfully Changing the user information for sky Enter the new value, or press ENTER for the default Full Name []: Room Number []: Work Phone []: Home Phone []: Other []: Is the information correct? [Y/n] y
Dear sky, your account sky has been created and is sudo enabled. Please use this account for your daily work from now on.
root@orangepi3:~#
2. Kernel Doublechecking
1
2
3
4
5
6
7
8
9
10
root@orangepi3:~# uname -r 5.1.0-sunxi64 root@orangepi3:~# uname -a Linux orangepi3 5.1.0-sunxi64 #5.86.190512 SMP Sun May 12 22:26:37 CEST 2019 aarch64 aarch64 aarch64 GNU/Linux root@orangepi3:~# lsb_release -a No LSB modules are available. Distributor ID: Ubuntu Description: Ubuntu 18.04.2 LTS Release: 18.04 Codename: bionic
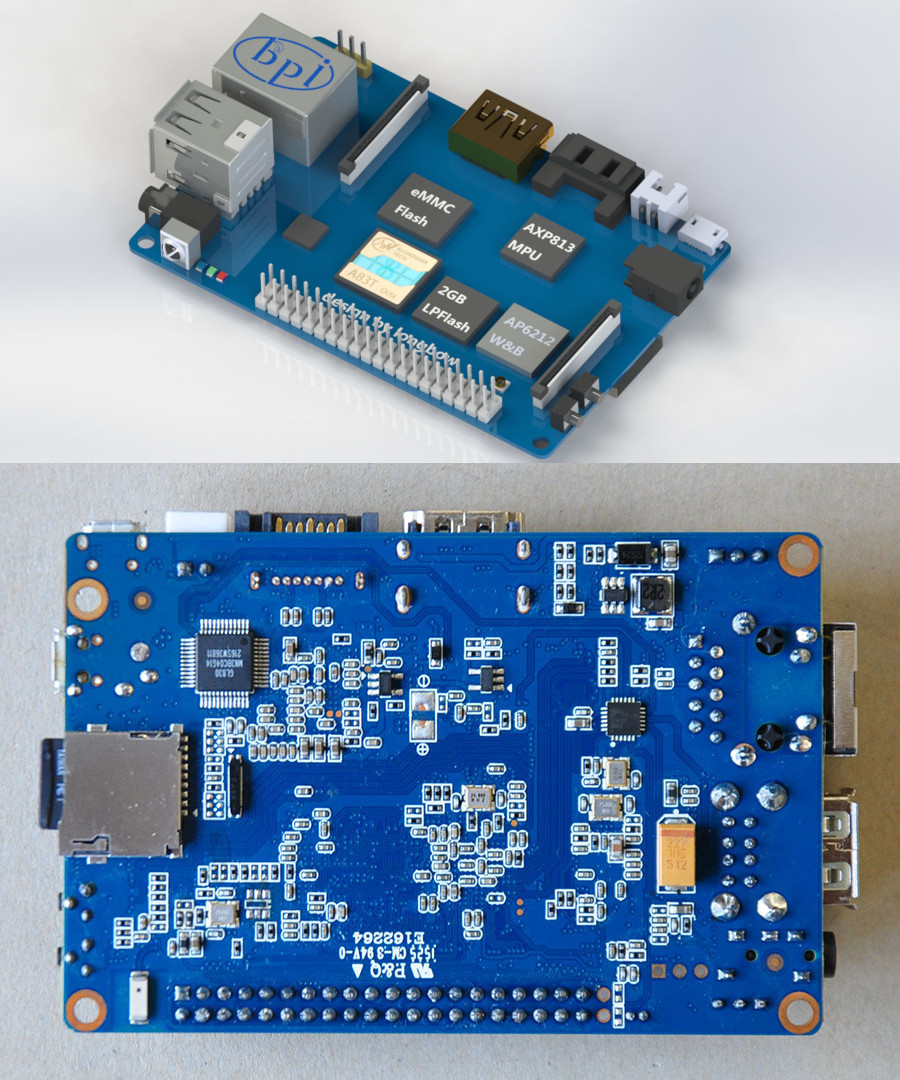
Hello, everybody. I’m now back in ShenZhen, China, and testing several types of Single Board Computers. I’ve got to say: Made In China is amazing. Banana Pi M3 is a SBC with AllWinner A83T ARM CPU, which is also of credit-card size. Some detailed features can be found on the open source technical supporter Sunxi. Please pay attention to the following key points:
PART A: Install Ubuntu Desktop Built By Armbian onto Banana Pi M3
1. Download Armbian Ubuntu Desktop for Banana Pi M3
We FIRST go visiting the website https://www.armbian.com/bananapi-m3/ and click Armbian Bionic icon, a file named Armbian_5.83_Bananapim3_Ubuntu_bionic_next_4.19.38_desktop will be automatically downloaded.
Files: 4 Size: 1946176594 Compressed: 441800089 ➜ operatingsystems ll Armbian_5.83_Bananapim3_Ubuntu_bionic_next_4.19.38_desktop total 1.9G -rw-rw-r-- 1 jiapei jiapei 1.9G Feb 10 22:50 Armbian_5.83_Bananapim3_Ubuntu_bionic_next_4.19.38_desktop.img -rw-rw-r-- 1 jiapei jiapei 833 Feb 10 22:50 Armbian_5.83_Bananapim3_Ubuntu_bionic_next_4.19.38_desktop.img.asc -rw-r--r-- 1 jiapei jiapei 19K Feb 10 22:50 armbian.txt -rw-rw-r-- 1 jiapei jiapei 129 Feb 10 22:50 sha256sum.sha
2. Install Armbian Ubuntu Desktop for Banana Pi M3
After the extracted image file is prepared, it’s the time to install the Armbian Ubuntu Desktop onto our TF card. We FIRST format the TF card:
1 2 3 4 5 6 7 8 9 10 11 12 13 14 15 16 17
➜ ~ sudo umount /dev/mmcblk0p1 umount: /dev/mmcblk0p1: not mounted. ➜ ~ sudo mkfs.ext4 /dev/mmcblk0 mke2fs 1.44.1 (24-Mar-2018) Found a gpt partition table in /dev/mmcblk0 Proceed anyway? (y,N) y Discarding device blocks: done Creating filesystem with 7579648 4k blocks and 1896832 inodes Filesystem UUID: 5c3be436-4e8c-43e4-ab21-6d5232420881 Superblock backups stored on blocks: 32768, 98304, 163840, 229376, 294912, 819200, 884736, 1605632, 2654208, 4096000
Allocating group tables: done Writing inode tables: done Creating journal (32768 blocks): done Writing superblocks and filesystem accounting information: done
Afterwards, use dd to install the downloaded Armbian Ubuntu Desktop image.
1 2 3 4
➜ Armbian_5.83_Bananapim3_Ubuntu_bionic_next_4.19.38_desktop sudodd bs=4M if=Armbian_5.83_Bananapim3_Ubuntu_bionic_next_4.19.38_desktop.img of=/dev/mmcblk0 conv=fsync 464+0 records in 464+0 records out 1946157056 bytes (1.9 GB, 1.8 GiB) copied, 258.486 s, 7.5 MB/s
PART B: SSH Into Armbian, Update & Upgrade, Network Configuration, Locale Configuration
NOTE: Whenever you met some unsolvable issue after you boot into Armbian, please use the command armbianmonitor -U to log the issue.
1. SSH Into Banana Pi M3
We now unplug the TF card from the host and put it into the Banana Pi M3, Armbian Ubuntu Desktop boots successfully. The default username and password are respectively: root and 1234. In our case, Banana Pi M3 is connected to a network cable first, and it’s NOT hard for us to get the IP address of Banana Pi M3 by using command line nmap (Details can be checked via Google). After setting up a NEW user as well as password by following the previous blog Install Armbian Ubuntu Desktop onto Banana Pi Pro, you should be able to log into Banana Pi M3 with account root:
➜ ~ ssh root@192.168.1.80 The authenticity of host '192.168.1.80 (192.168.1.80)' can't be established. ECDSA key fingerprint is SHA256:xLRt0ppGzbutHHcE3JRyaKw9A0baub3MDAxFF9GNfdk. Are you sure you want to continue connecting (yes/no)? yes Warning: Permanently added '192.168.1.80' (ECDSA) to the list of known hosts. root@192.168.1.80's password: ____ ____ _ __ __ _____ | __ ) __ _ _ __ __ _ _ __ __ _ | _ \(_) | \/ |___ / | _ \ / _` | '_ \ / _` | '_ \ / _` | | |_) | | | |\/| | |_ \ | |_) | (_| | | | | (_| | | | | (_| | | __/| | | | | |___) | |____/ \__,_|_| |_|\__,_|_| |_|\__,_| |_| |_| |_| |_|____/
Welcome to ARMBIAN 5.83 stable Ubuntu 18.04.2 LTS 4.19.38-sunxi System load: 0.08 0.10 0.08 Up time: 33 min Memory usage: 12 % of 2013MB IP: 192.168.1.80 Usage of /: 6% of 29G
[ General system configuration (beta): armbian-config ]
Last login: Thu Apr 18 08:53:31 2019 from 192.168.1.21
root@bananapim3:~#
2. Kernel Doublechecking
Finally, we have the system and kernel doublechecked.
1 2 3 4 5 6 7 8 9 10
root@bananapim3:~# uname -r 4.19.38-sunxi root@bananapim3:~# uname -a Linux bananapim3 4.19.38-sunxi #5.83 SMP Sun Feb 10 21:36:17 CET 2019 armv7l armv7l armv7l GNU/Linux root@bananapim3:~# lsb_release -a No LSB modules are available. Distributor ID: Ubuntu Description: Ubuntu 18.04.2 LTS Release: 18.04 Codename: bionic
Today seems to be the FIRST big day pf 2019? So many important packages (including operating systems) have released their NEW updates. Alright, let’s take a look what I’ve done today.
Updates Today
Ubuntu 18.04.2
1 2 3 4 5 6 7 8
➜ ~ uname -r 4.18.0-15-generic ➜ ~ lsb_release -a No LSB modules are available. Distributor ID: Ubuntu Description: Ubuntu 18.04.2 LTS Release: 18.04 Codename: bionic
➜ ~ nvcc --version nvcc: NVIDIA (R) Cuda compiler driver Copyright (c) 2005-2019 NVIDIA Corporation Built on Fri_Feb__8_19:08:17_PST_2019 Cuda compilation tools, release 10.1, V10.1.105 ➜ ~ deviceQuery deviceQuery Starting...
CUDA Device Query (Runtime API) version (CUDART static linking)
Detected 1 CUDA Capable device(s)
Device 0: "GeForce GTX 980M" CUDA Driver Version / Runtime Version 10.1 / 10.1 CUDA Capability Major/Minor version number: 5.2 Total amount of global memory: 4035 MBytes (4231331840 bytes) (12) Multiprocessors, (128) CUDA Cores/MP: 1536 CUDA Cores GPU Max Clock rate: 1126 MHz (1.13 GHz) Memory Clock rate: 2505 Mhz Memory Bus Width: 256-bit L2 Cache Size: 2097152 bytes Maximum Texture Dimension Size (x,y,z) 1D=(65536), 2D=(65536, 65536), 3D=(4096, 4096, 4096) Maximum Layered 1D Texture Size, (num) layers 1D=(16384), 2048 layers Maximum Layered 2D Texture Size, (num) layers 2D=(16384, 16384), 2048 layers Total amount of constant memory: 65536 bytes Total amount of shared memory per block: 49152 bytes Total number of registers available per block: 65536 Warp size: 32 Maximum number of threads per multiprocessor: 2048 Maximum number of threads per block: 1024 Max dimension size of a thread block (x,y,z): (1024, 1024, 64) Max dimension size of a grid size (x,y,z): (2147483647, 65535, 65535) Maximum memory pitch: 2147483647 bytes Texture alignment: 512 bytes Concurrent copy and kernel execution: Yes with 2 copy engine(s) Run time limit on kernels: Yes Integrated GPU sharing Host Memory: No Support host page-locked memory mapping: Yes Alignment requirement for Surfaces: Yes Device has ECC support: Disabled Device supports Unified Addressing (UVA): Yes Device supports Compute Preemption: No Supports Cooperative Kernel Launch: No Supports MultiDevice Co-op Kernel Launch: No Device PCI Domain ID / Bus ID / location ID: 0 / 1 / 0 Compute Mode: < Default (multiple host threads can use ::cudaSetDevice() with device simultaneously) >
deviceQuery, CUDA Driver = CUDART, CUDA Driver Version = 10.1, CUDA Runtime Version = 10.1, NumDevs = 1 Result = PASS
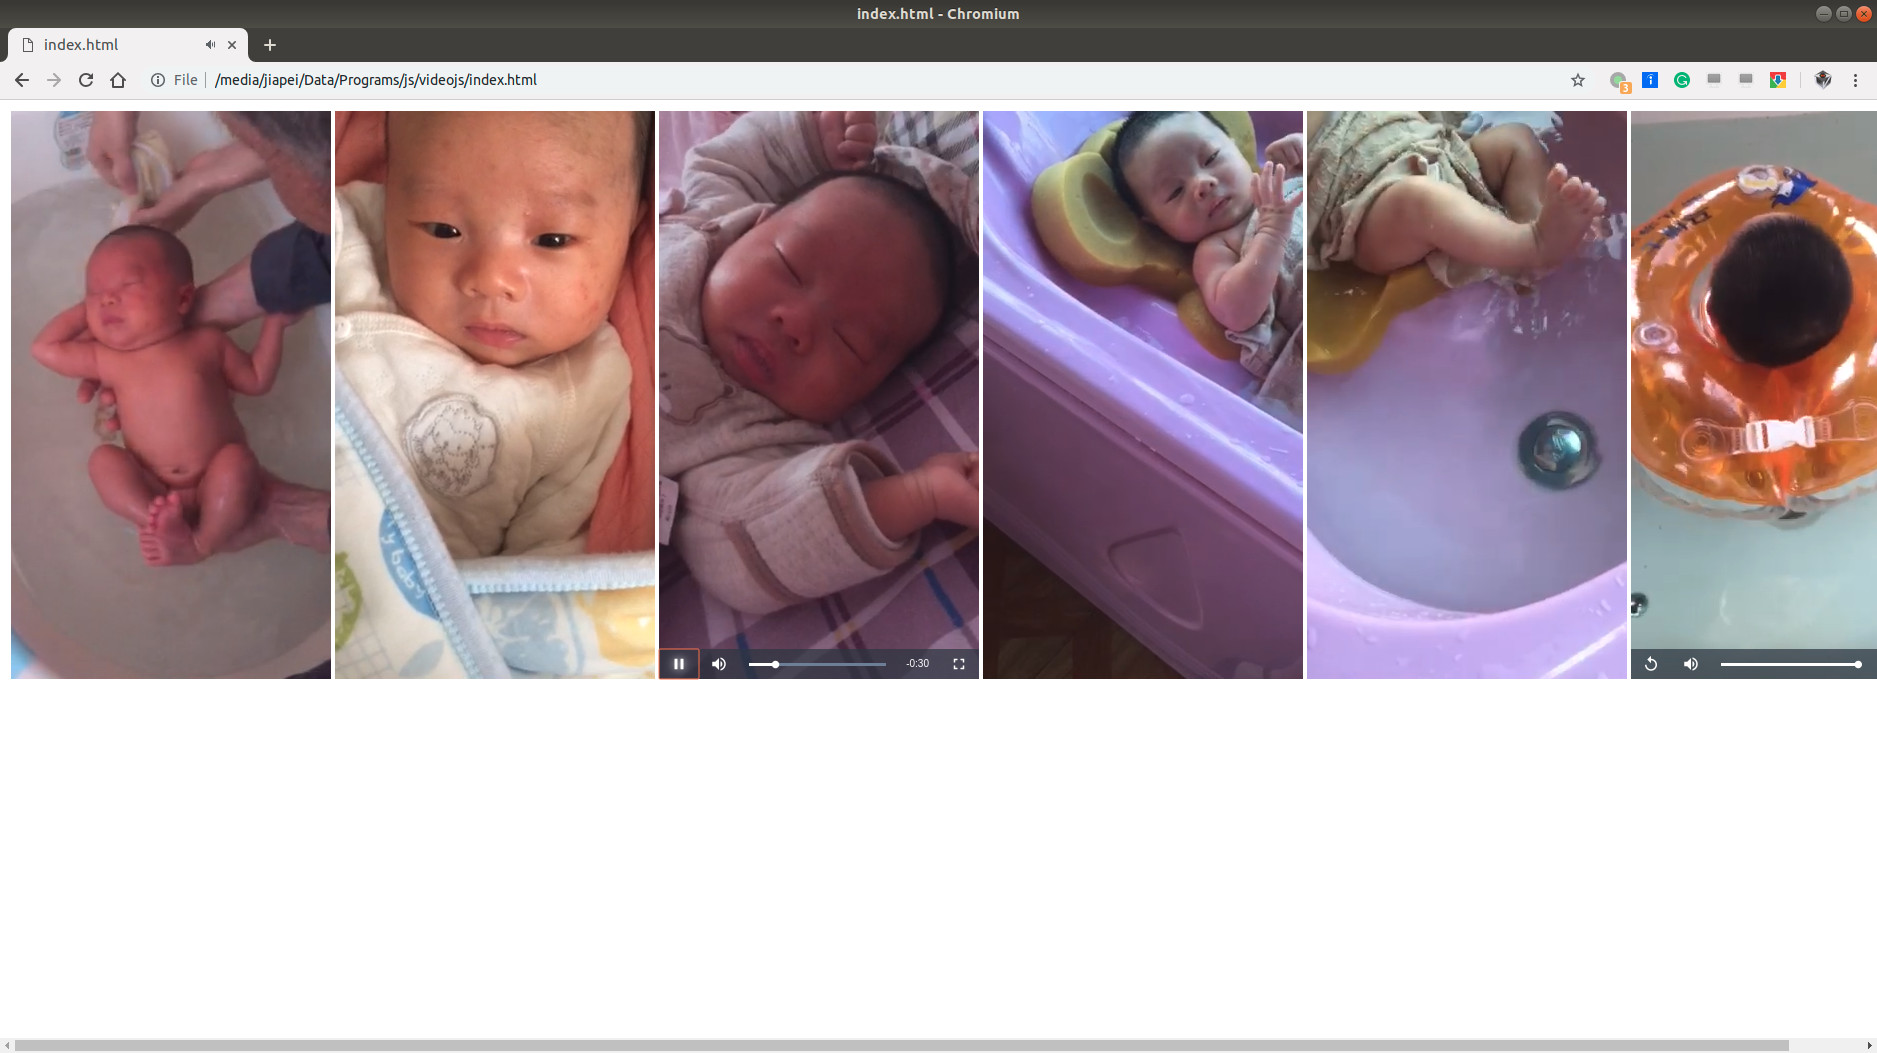
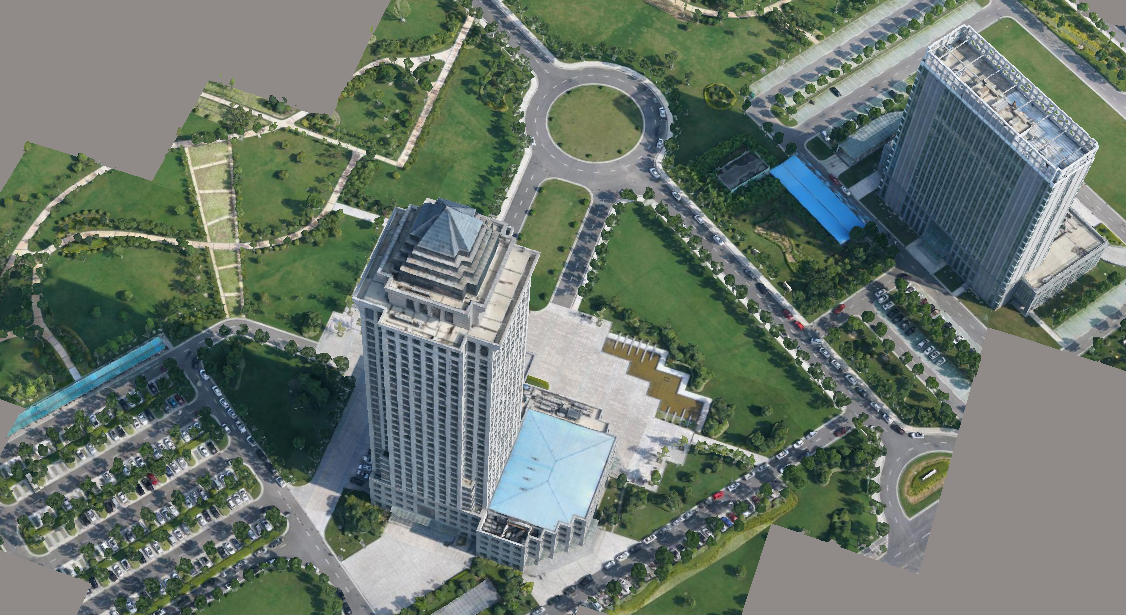
Indoor surveying & mapping is done by a cluster of servers, namely, on a small cloud. Currently, we are still dockerizing our own SDK. Three videos are used to briefly explain the MOST important three steps of indoor surveying & mapping, as shown:
After TorchSeg is checked out, we need to modify all the config.py files and ensure all variables C.pretrained_model are specified to the RIGHT location and with the RIGHT names. In my case, I just downloaded all PyTorch models under the same directory as TorchSeg, therefore, all C.pretrained_model are designated as:
We also need to modify all variables C.dataset_path and make sure we are using the RIGHT dataset. In fact, ONLY two datasets are directly adopted in the originally checked-out code of TorchSeg.
➜ ~ pip show prophet Name: prophet Version: 0.1.1 Summary: Microframework for analyzing financial markets. Home-page: http://prophet.michaelsu.io/ Author: Michael Su Author-email: mdasu1@gmail.com License: BSD Location: /home/jiapei/.local/lib/python3.6/site-packages Requires: six, pytz, pandas Required-by: ➜ ~ pip show pystan Name: pystan Version: 2.18.1.0 Summary: Python interface to Stan, a package for Bayesian inference Home-page: https://github.com/stan-dev/pystan Author: None Author-email: None License: GPLv3 Location: /home/jiapei/.local/lib/python3.6/site-packages Requires: Cython, numpy Required-by: fbprophet
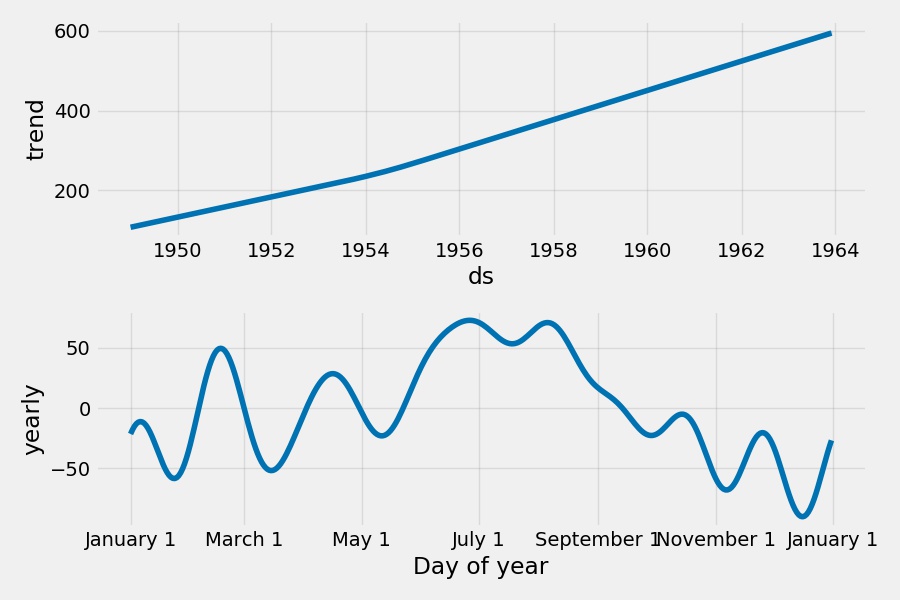
Download the Time Series Data
We just need to download the CSV file to some directory:
1 2 3 4
➜  facebookprophet curl -O https://assets.digitalocean.com/articles/eng_python/prophet/AirPassengers.csv
  % Total    % Received % Xferd  Average Speed   Time    Time     Time  Current
                                 Dload  Upload   Total   Spent    Left  Speed
100  1748  100  1748    0     0   2281      0 --:--:-- --:--:-- --:--:--  2279